CALCULATEDRISK
By Bill McBride
Median New Home Price is Down 10% from the Peak due to Change in Mix
The Census Bureau reports New Home Sales in December were at a seasonally adjusted annual rate (SAAR) of 745 thousand. November sales were at 758 thousand. The previous three months (August through October) were revised down sharply.
Sales of new single-family houses in December 2025 were at a seasonally-adjusted annual rate of 745,000, according to estimates released jointly today by the U.S. Census Bureau and the Department of Housing and Urban Development. This is 1.7 percent below the November 2025 rate of 758,000, and is 3.8 percent above the December 2024 rate of 718,000.
Sales of new single-family houses in November 2025 were at a seasonally-adjusted annual rate of 758,000. This is 15.5 percent above the revised October 2025 rate of 656,000.
An estimated 679,000 new homes were sold in 2025. This is 1.1 percent below the 2024 figure of 686,000.
emphasis added
The first graph shows New Home Sales vs. recessions since 1963. The dashed line is the current sales rate.
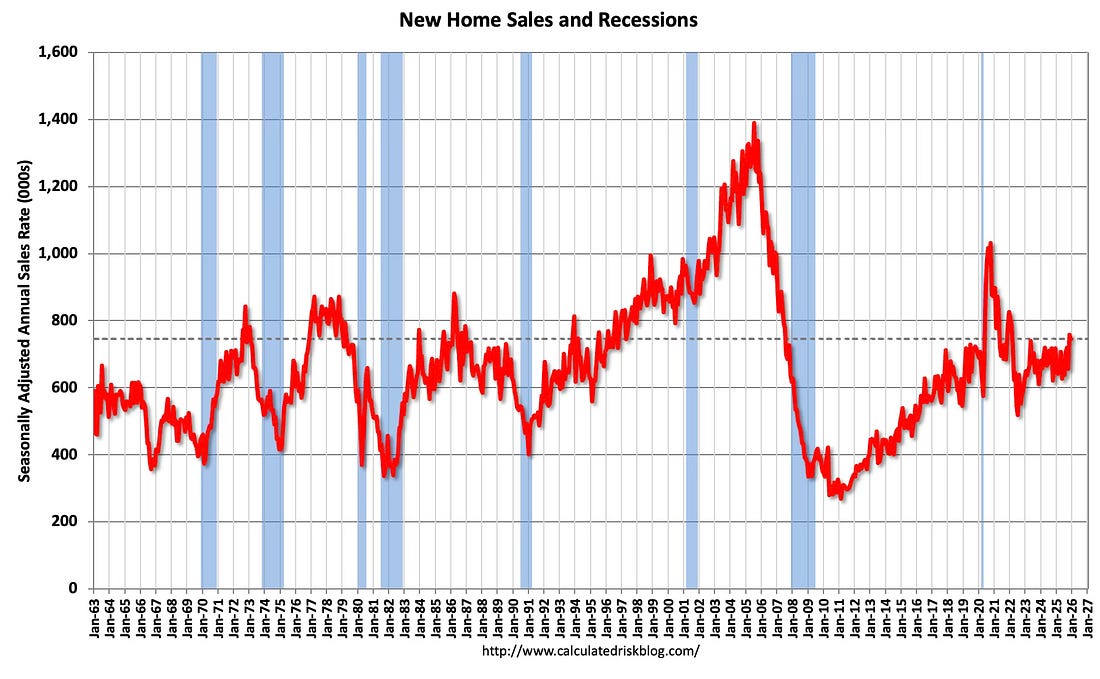
New home sales were above pre-pandemic levels. There is significant uncertainty with these initial estimates due to the shutdown, and it is likely the last two months will be revised down. The second graph shows New Home Months of Supply.
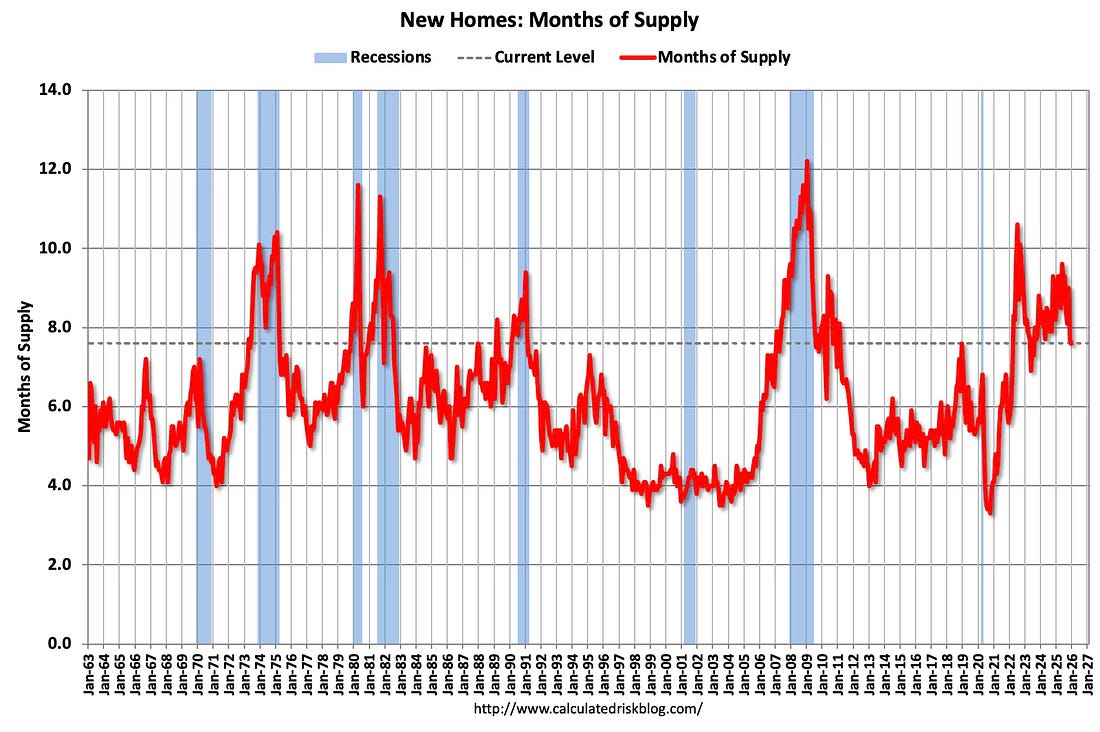
The months of supply was declined in December to 7.6 months from 7.7 months in November. The all-time record high was 12.2 months of supply in January 2009. The all-time record low was 3.3 months in August 2020. This is above the top of the normal range (about 4 to 6 months of supply is normal).
The seasonally-adjusted estimate of new houses for sale at the end of December 2025 was 472,000. This is 2.7 percent below the November 2025 estimate of 485,000, and is 3.5 percent below the December 2024 estimate of 489,000.
This represents a supply of 7.6 months at the current sales rate. The months’ supply is 1.3 percent below the November 2025 estimate of 7.7 months, and is 7.3 percent below the December 2024 estimate of 8.2 months.
On inventory, according to the Census Bureau:
“A house is considered for sale when a permit to build has been issued in permit-issuing places or work has begun on the footings or foundation in nonpermit areas and a sales contract has not been signed nor a deposit accepted.”
Starting in 1973 the Census Bureau broke this down into three categories: Not Started, Under Construction, and Completed. The third graph shows the three categories of inventory starting in 1973.
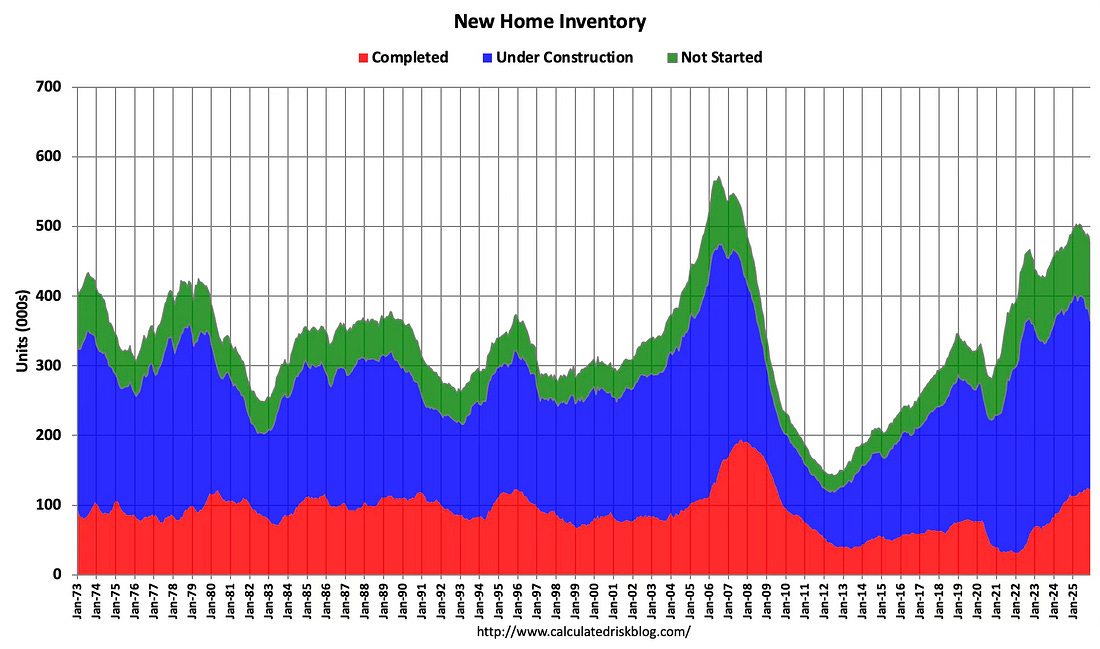
The inventory of completed homes for sale (red) – at 123 thousand – is almost quadruple the record low of 31 thousand in February 2022. This is close to the most since July 2009, and above the normal level of completed homes for sale.
The inventory of homes under construction (blue) at 241 thousand is high but is about 25% below the cycle peak in July 2022. The inventory of homes not started is at 108 thousand – this is the all-time high.
The fourth graph shows new home sales for each month, Not Seasonally Adjusted (NSA), for a few selected periods. Black is the maximum sales per month during the bubble (2005) and light gray is the minimum sales during the bust (2008 – 2011). The most recent six years are shown (2019 through 2025).
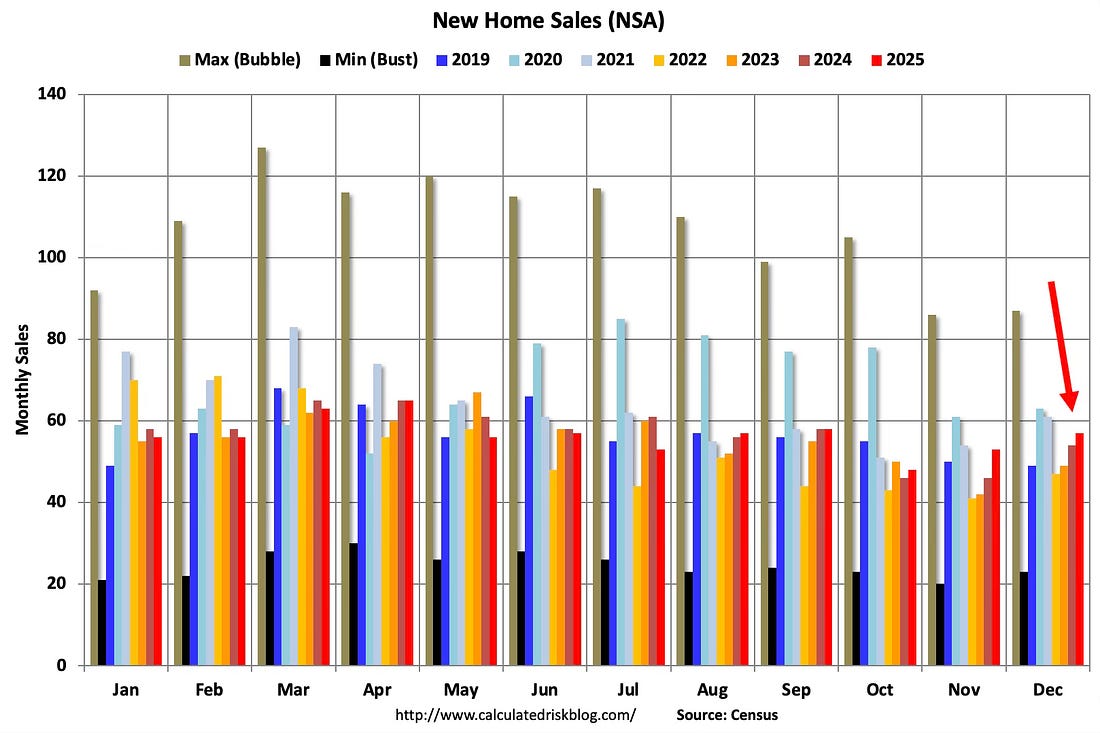
In December 2025 (red column), 57 thousand new homes were sold (NSA). Last year, 54 thousand homes were sold in December. The all-time high for December was 87 thousand in 2005, and the all-time low for December was 23 thousand in 2010.
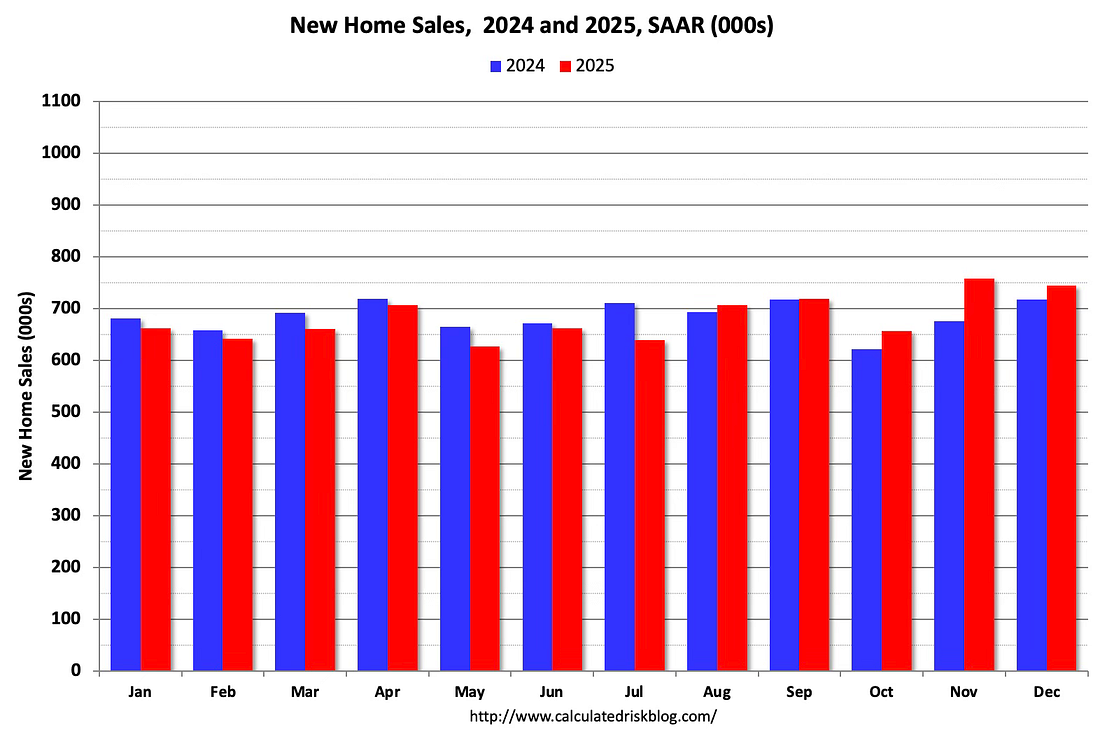
The next graph shows new home sales for 2024 and 2025 by month (Seasonally Adjusted Annual Rate). Sales in December 2025 were up 3.8% from December 2024. On annual basis, sales were at 679,000 in 2025 down 1.1% from 686,000 homes sold in 2024.
Almost 4 Months of Unsold Inventory Under Construction
The next graph shows the months of supply by stage of construction. “Months of supply” is inventory at each stage, divided by the sales rate.
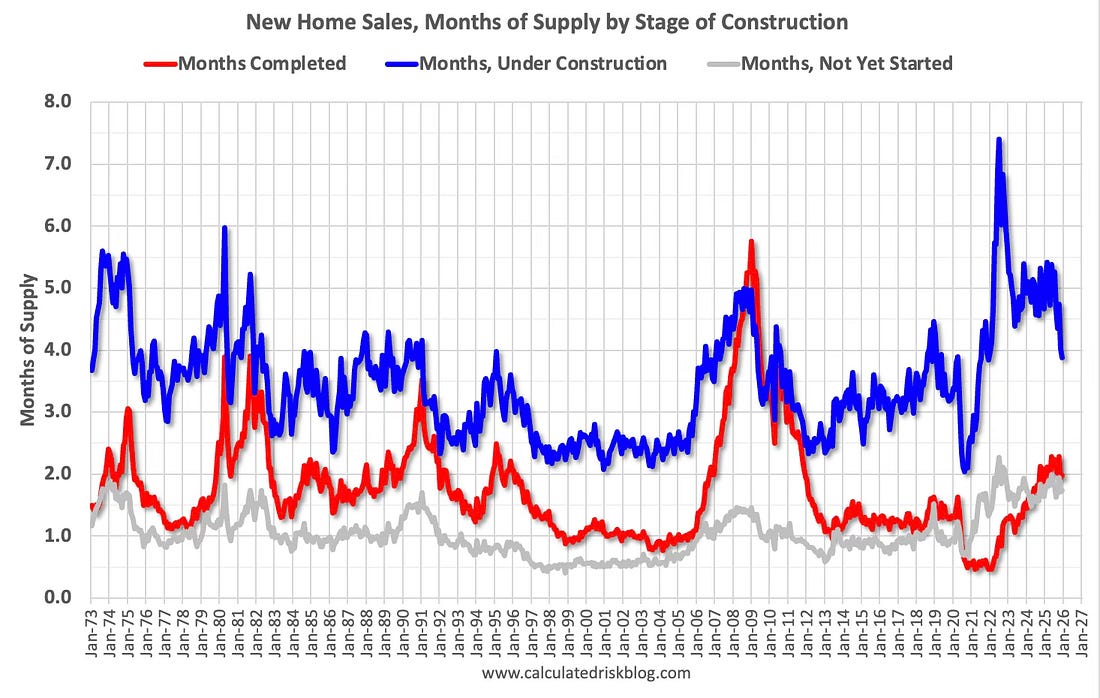
There are 2.0 months of completed supply (red line). This is above the normal level.
The inventory of new homes under construction is at 3.9 months (blue line). This has declined from 7.4 months in July 2022 but is still a larger than normal number of homes under construction.
And 1.7 months of potential inventory that have not been started (grey line) – above the normal level. Homebuilders are probably waiting to start some homes until they clear more inventory, and have a firmer grasp on prices, mortgage rates and demand.
Median Prices Down 10% from the Peak
And on prices, from the Census Bureau:
The median sales price of new houses sold in December 2025 was $414,400. This is 4.2 percent above the November 2025 price of $397,600, and is 2.0 percent below the December 2024 price of $423,000. The average sales price of new houses sold in December 2025 was $532,600. This is 0.5 percent above the November 2025 price of $530,200, and is 4.7 percent above the December 2024 price of $508,900.
The following graph shows the median and average new home prices. The average price in December 2025 was $532,600 up 4.7% year-over-year. The median price was $414,400, down 2.0% year-over-year. Both the median and the average are impacted by the mix of homes sold and have mostly drifted down slightly over the last few years.
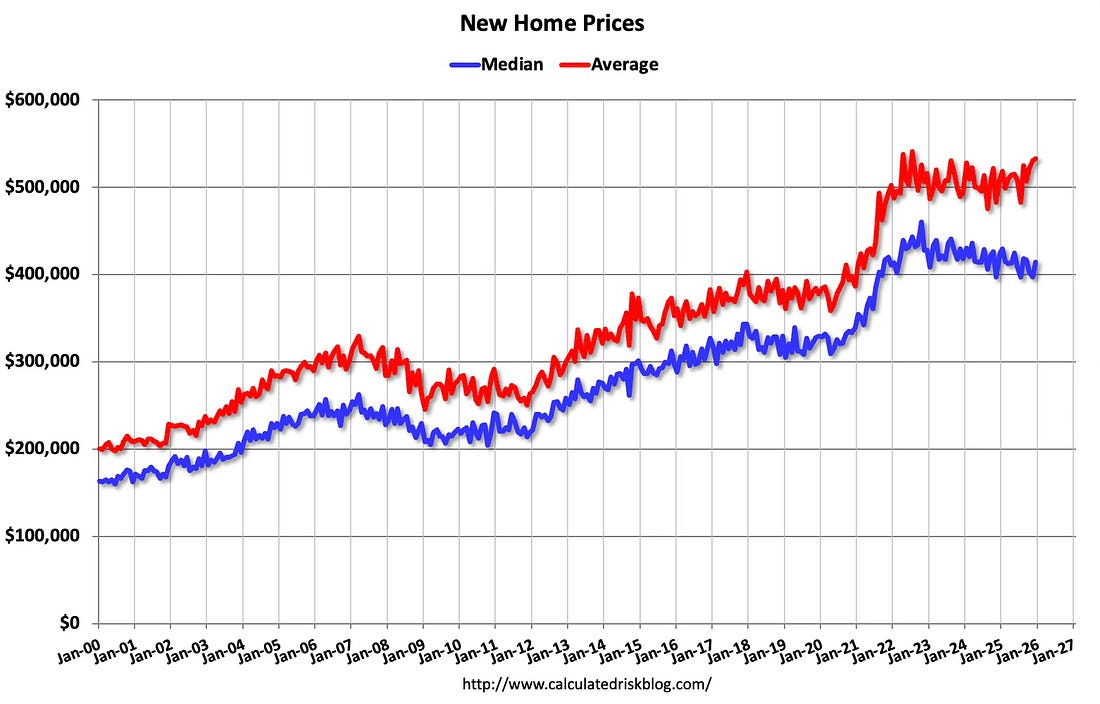
The median price was down 10.0% from the peak in 2022, and the average prices is down 1.6% from the peak. This just means builders are selling more lower priced units!
The last graph shows the percent of new homes sold by price. NOTE: In early 2024, the Census Bureau changed “the sales price range groups in … New Privately‐Owned Houses Sold, by Sales Price … to better reflect the current distribution of new home prices”. Prior to 2020 the top two categories were different (as indicated), and this probably increased the purple portion of the graph (reduced from $749K+ to $600K+).
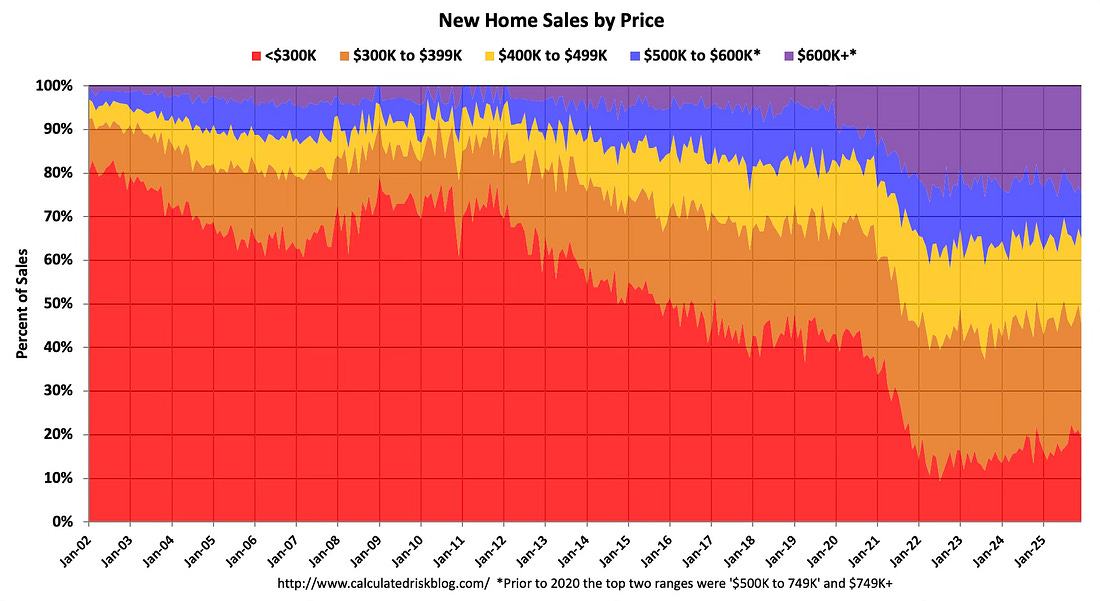
About 19% of new homes sold were under $300K in December 2025. This is up from a low of 9.3% in July 2022, but down from around 80% in 2002. In general, the under $300K bracket is going away (inflation has pushed prices higher).
Last month, 65% of sales were under $500K and 35% over $500K. The percent over $500K is down from 42% at the peak in 2022. Homebuilders have been building less expensive homes to keep up volumes.
Sales were slightly above expectations of 735 thousand SAAR in December, however, sales for the three previous months (August through October) were revised down sharply.
Mortgage rates moved down from an average 6.24% in November 2025 (Freddie Mac PMMS), to 6.19% in December 2025. So a combination of lower priced homes, and lower mortgage rates, probably motivated some buyers.
Rates moved down further in January 2026 to an average of 6.10%.
Typically, if lower rates boost sales, it will show up in new home sales before existing home sales since new home sales are reported when the contract is signed whereas existing home sales are reported when the contract closes. However, homebuilders are also building less expensive homes – so the recent pickup in new home sales might not indicate a similar pickup in existing home sales.