Calculated Risk
New Home Average Prices Down 5.3% Year-over-year
The Census Bureau reports New Home Sales in January were at a seasonally adjusted annual rate (SAAR) of 670 thousand.
The previous three months were revised down, combined.
Sales of new single‐family houses in January 2023 were at a seasonally adjusted annual rate of 670,000, according to estimates released jointly today by the U.S. Census Bureau and the Department of Housing and Urban Development. This is 7.2 percent above the revised December rate of 625,000, but is 19.4 percent below the January 2022 estimate of 831,000.
emphasis added
The first graph shows New Home Sales vs. recessions since 1963. The dashed line is the current sales rate.

New home sales are close to pre-pandemic levels. The second graph shows New Home Months of Supply.
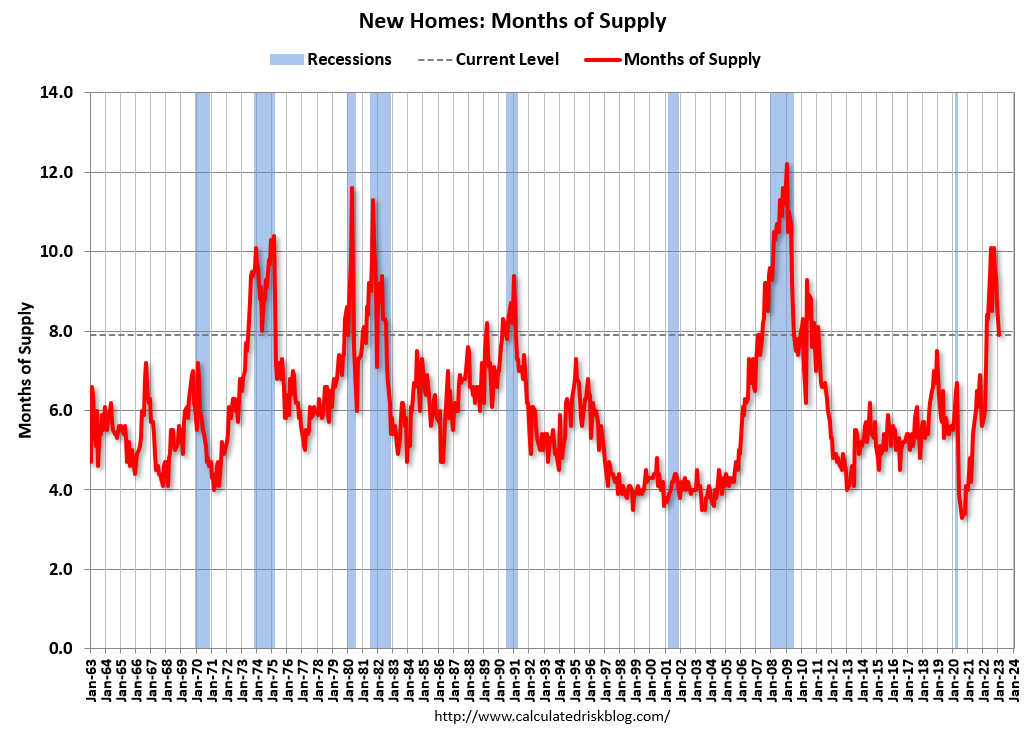
The months of supply decreased in January to 7.9 months from 8.7 months in December. The all-time record high was 12.1 months of supply in January 2009. The all-time record low was 3.5 months, most recently in October 2020. This is well above the top of the normal range (about 4 to 6 months of supply is normal).
“The seasonally‐adjusted estimate of new houses for sale at the end of January was 439,000. This represents a supply of 7.9 months at the current sales rate.”
On inventory, according to the Census Bureau:
“A house is considered for sale when a permit to build has been issued in permit-issuing places or work has begun on the footings or foundation in non-permit areas and a sales contract has not been signed nor a deposit accepted.”
Starting in 1973 the Census Bureau broke this down into three categories: Not Started, Under Construction, and Completed.
The third graph shows the three categories of inventory starting in 1973.

The inventory of completed homes for sale (red) – at 68 thousand – is more than double the record low of 32 thousand in 2021 and early 2022. This is getting close to the normal level of completed homes for sale and increasing.
The inventory of homes under construction (blue) at 280 thousand is very high, and about 11% below the cycle peak in July 2022. The inventory of homes not started is at 91 thousand – below the record peak of 102 thousand.
The fourth graph shows existing home sales for each month, Not Seasonally Adjusted (NSA), for a few selected periods. Black is the maximum sales per month during the bubble (2005) and light gray is the minimum sales during the bust (2008 – 2011). The most recent five years are shown (2019 through 2023).
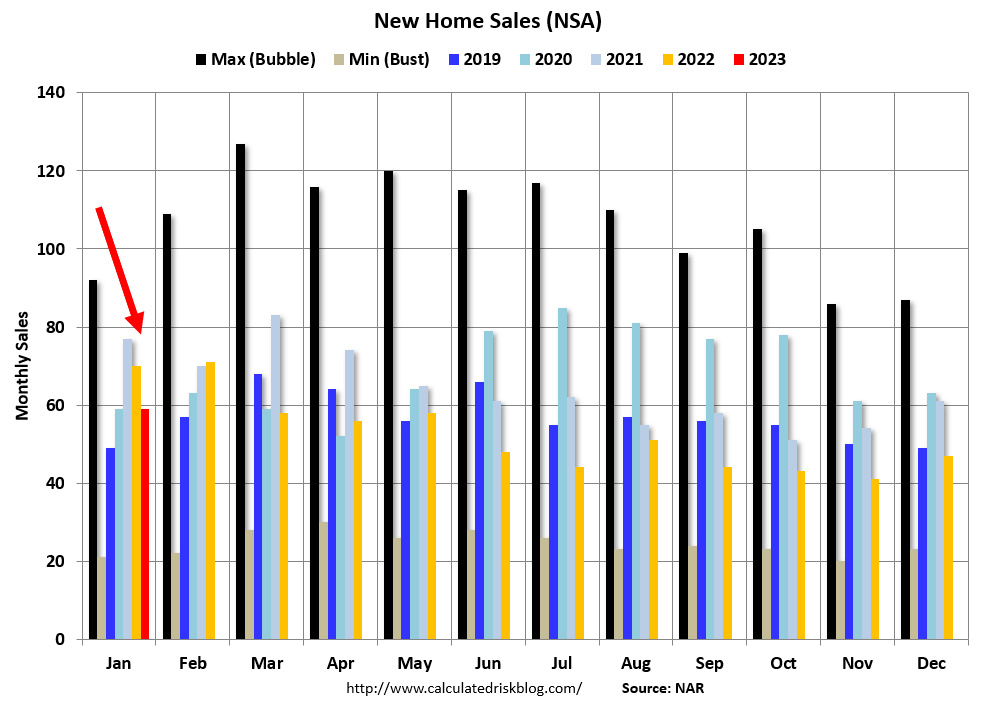
In January 2023 (red column), 59 thousand new homes were sold (NSA). Last year, 70 thousand homes were sold in January. The all-time high for January was 92 thousand in 2005, and the all-time low for January was 21 thousand in 2011.
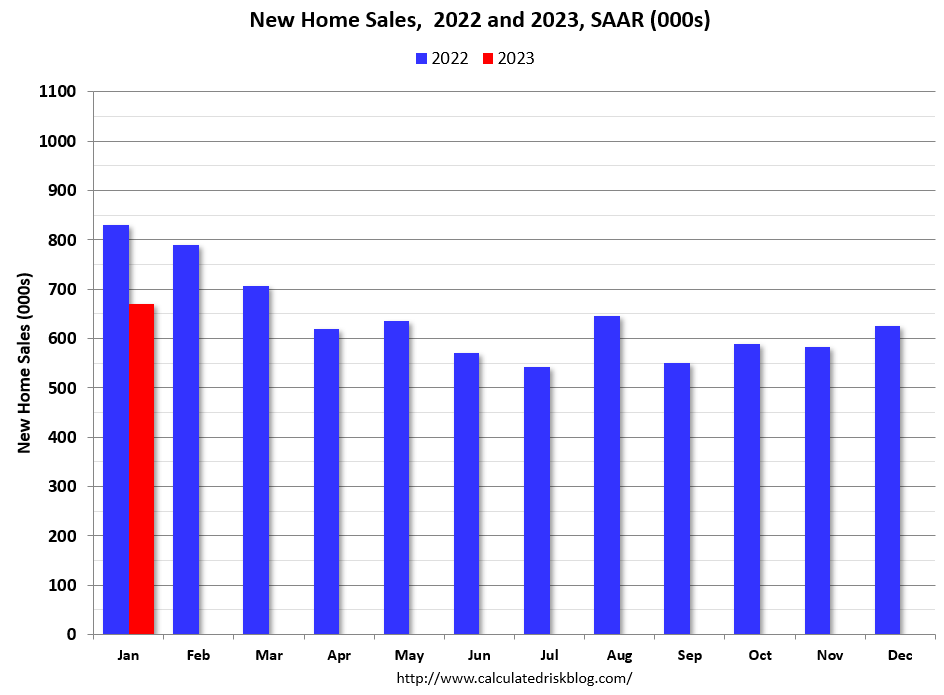
The next graph shows new home sales for 2022 and 2023 by month (Seasonally Adjusted Annual Rate). Sales in January 2023 were down 19.4% from January 2022.
Five Months of Unsold Inventory Under Construction
The next graph shows the months of supply by stage of construction. “Months of supply” is inventory at each stage, divided by the sales rate.
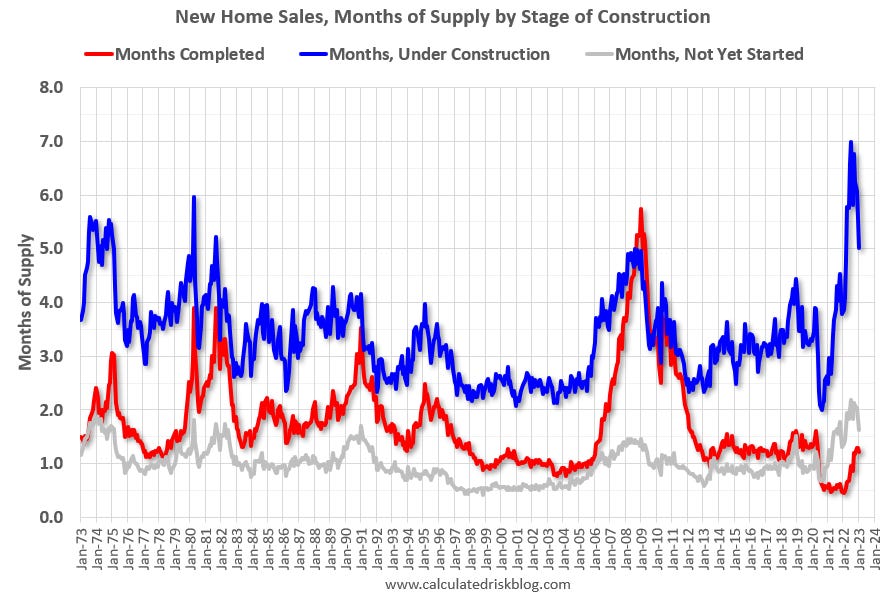
There are 1.2 months of completed supply (red line). This is close to the normal level.
The inventory of new homes under construction is at 5.0 months (blue line). This elevated level of homes under construction is due to supply chain constraints.
And about 1.6 months of potential inventory have not been started (grey line) – about double the normal level. Homebuilders are probably waiting to start some homes until they have a firmer grasp on prices and demand.
New Home Average Prices Down 5.3% Year-over-year
And on prices, from the Census Bureau:
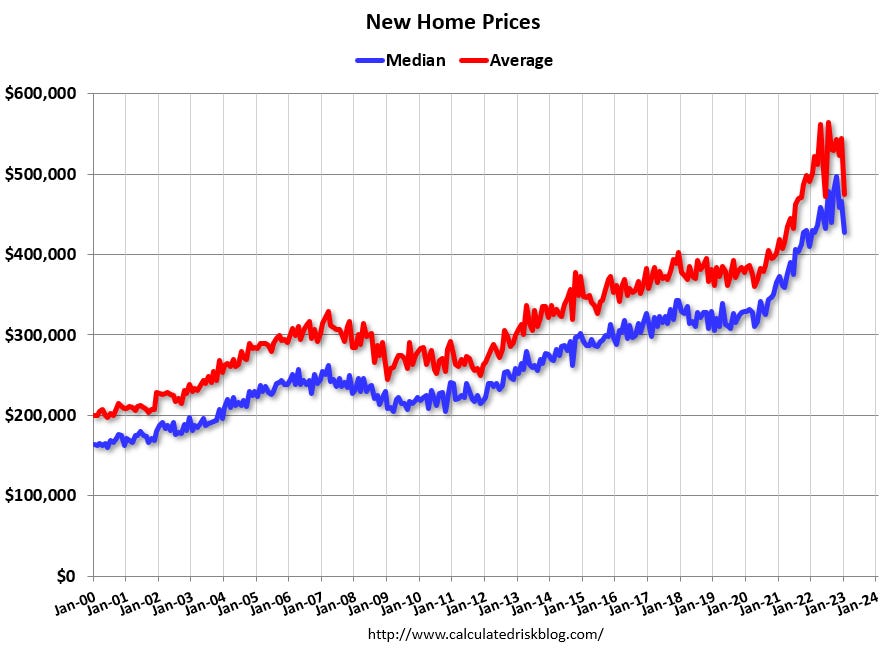
The median sales price of new houses sold in January 2023 was $427,500. The average sales price was $474,400.
The following graph shows the median and average new home prices. The average price in January 2023 was $474,400 down 5.3% year-over-year. The median price was $427,500 down 0.7% year-over-year. This suggests a year-over-year decrease in prices, although both the median and the average are impacted by the mix of homes sold.
The last graph shows the percent of new homes sold by price.
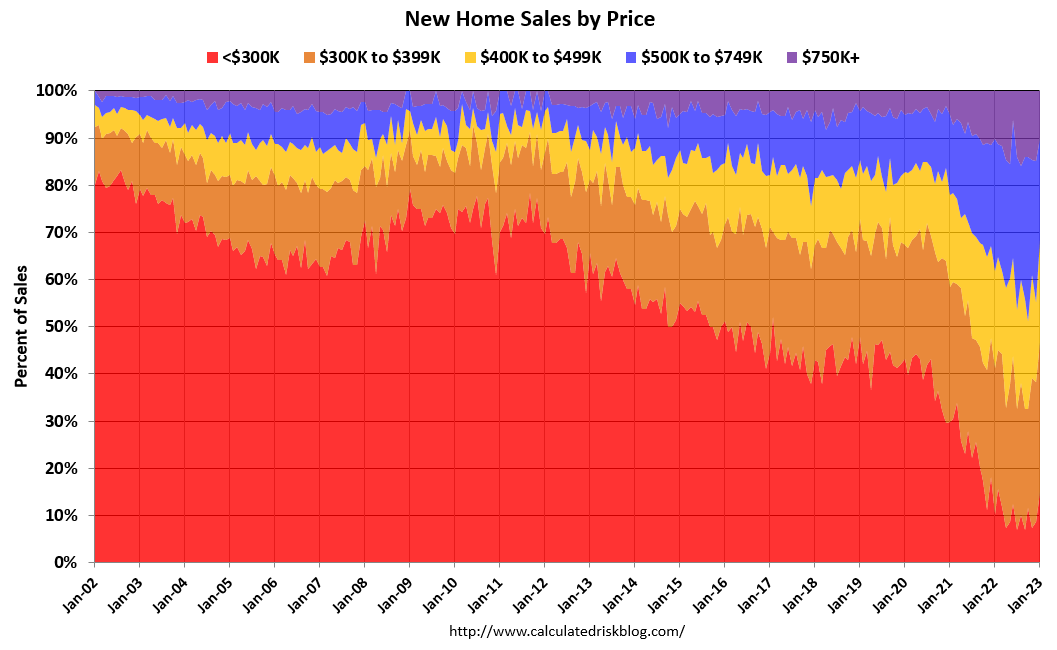
About 15% of new homes sold were under $300K in January 2023. This is up from recent months, but down from around 80% in 2002. In general, the under $300K bracket is going away (inflation has pushed prices higher).
In January, we saw an increase in the percent sales in the under $500K range (to 68%), and a decrease in percent sales above $500K (to 32%).
Conclusion
This was for contracts signed in January when mortgage rates were lower – and builders were buying down rates. Mortgage rates increased again in February, and that will likely impact sales.
As previously discussed, the Census Bureau overestimates sales, and underestimates inventory when cancellation rates are rising, see: New Home Sales and Cancellations: Net vs Gross Sales. So, take the headline sales number with a large grain of salt – the actual negative impact on the homebuilders is far greater than the headline number suggests (until cancellations start declining)!
This will reverse when cancellation rates start declining. When a previously cancelled home is resold, the home builder counts it as a sale, but the Census Bureau does not (since it was already counted).
There are a large number of homes under construction, and this suggests we will see a further sharp increase in completed inventory over the next several months – and that will keep pressure on new home prices.