Realtor.com
Highlights:
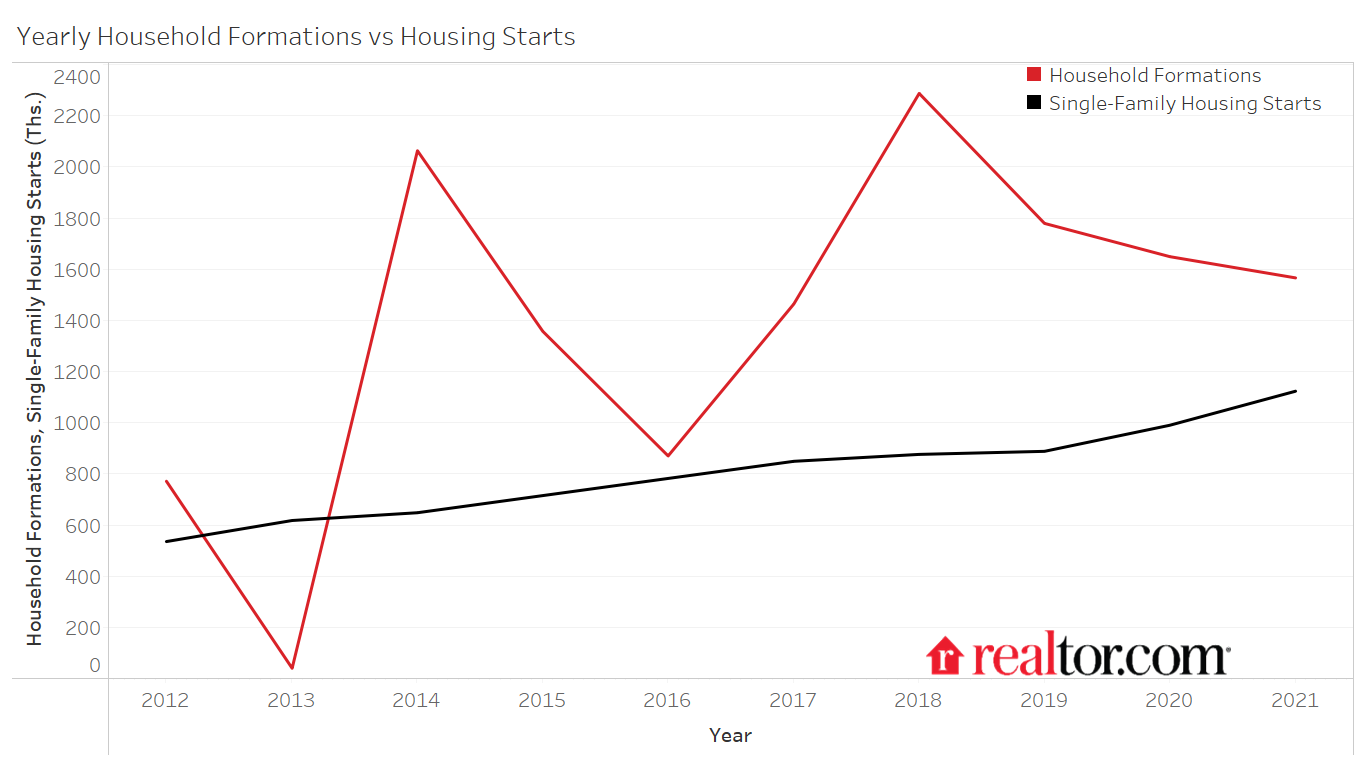
- In 2021, the U.S. saw 1.6 million household formations, resulting in 13.8 million household formations between 2012 and 2021. In this time period, 8 million single-family homes were started, and 7.5 million single-family homes were completed.
- The number of US households reached an all-time high in December 2021, surpassing the previous high in August 2020.
- The gap between single-family home constructions and household formations grew from 3.84 million homes at the beginning of 2019 to 5.8 million homes as of the end of 2021.
- At the five-year average rate of housing starts and household formation, the gap would only widen.
- Assuming household formations continue at current 5-year average, the average rate of home completion would have to triple to close the gap in home completions and household formations in 5 to 6 years.
- If instead household formations slow down to 800,000 households per year (around 2015-2016 levels) and housing starts sustain current rates, it will only take double the rate of housing starts (as assessed in 2021) to close the gap in 3-4 years, assuming completions keep pace.
- Builders accelerated production, supply chain issues limit completions:
- In 2021, 1.1 million homes were started, which is 13.4% more than in 2020.
- Home starts per 1000 households increased sizably in 2021, from 7.9 in 2020 to 8.9 in 2021, indicating acceleration.
- The gap between housing starts and completions reached 16.1% more starts than completions, a recent high, due to supply chain issues.
- A decreasing proportion of affordable homes are being built and sold in 2021 compared to 2018-2020. Only 25% of new homes were sold for less than $300,000 in 2021, down from 42% in 2018.
- Builders continue to ramp up most in the South and West:
- 57% of home starts in 2021 were in the South, and almost 24% were in the West.
- In 2021, 14.6% of all building permits were granted in Dallas, Houston, Austin, and San Antonio, Texas metro areas. Similarly, 13.3% of all permits were granted to Florida metros in 2021.
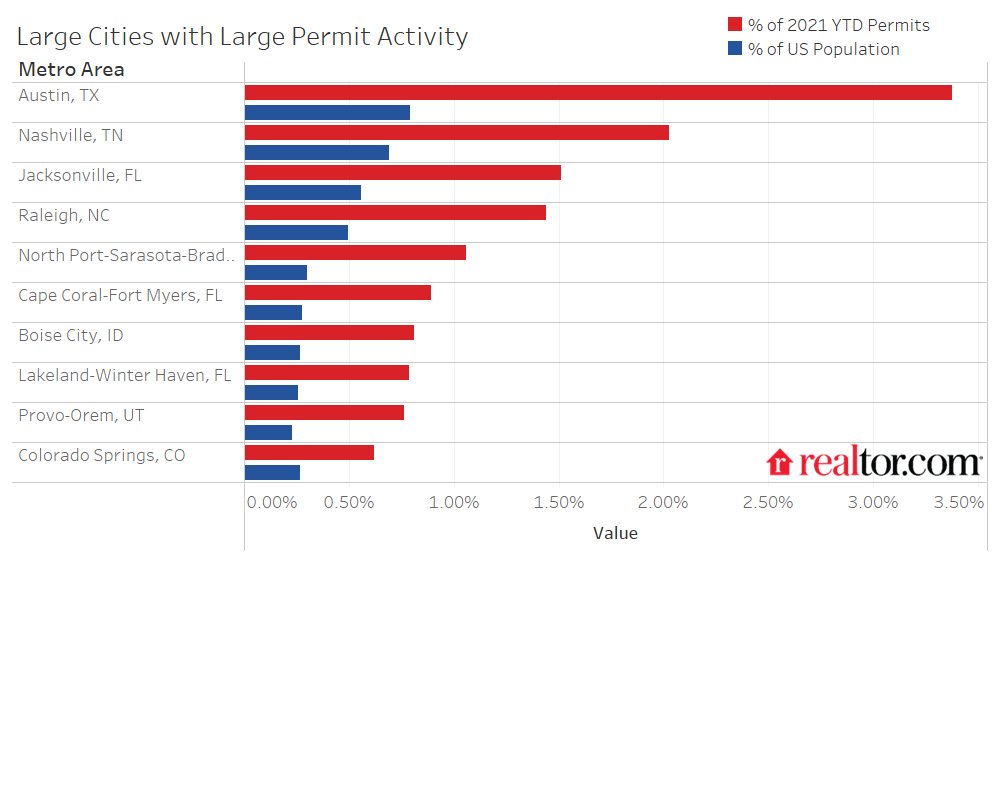
- Trends from the first half of 2021 continued as cities such as Austin (TX), North Port-Sarasota-Bradenton (FL), Nashville (TN), Raleigh (NC), and Jacksonville (FL), are seeing an outsized proportion of housing permits.
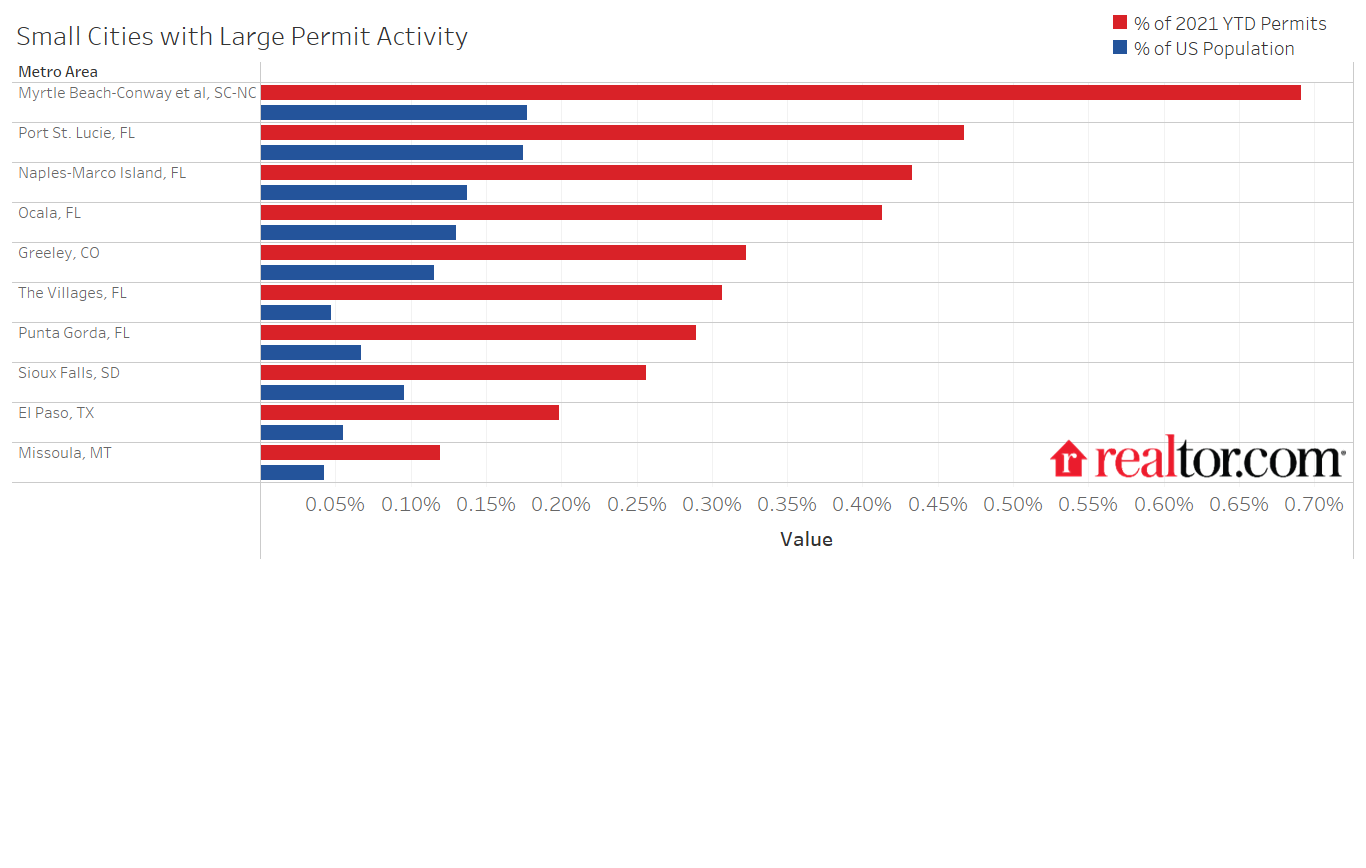
- Smaller scenic towns such as Boise City, ID, and Provo, UT as well as beach towns across Florida are seeing significant proportions of building permits relative to their size.
- After a slight lull in fall 2021, builder confidence strengthened through the end of 2021 and into January 2022.
The Pandemic’s Influence on the Housing Market Continues
It has been nearly two years since the Coronavirus pandemic changed daily life worldwide, and the housing market has not settled back into old ways. As discussed in the previous housing supply update, being stuck at home led to a re-examination of home life at a time when demographics were already favorable for housing, resulting in increased housing demand across the country. However, as housing demand ramped up, the construction industry ran into issues with material and labor scarcity, driving the cost of both inputs up and widening the already large gap between home construction and household formations. Housing demand was strong enough that these hang-ups did not stifle home sales growth, but these trends exacerbated the preexisting shortage. In the second half of 2021, single-family homes were being both started and completed at the fastest pace in the last decade. However, home completions did not keep pace with starts as supply chain issues hindered building activity. Additionally, though household formations led to an all-time high number of US households, the rate of formation was just slightly slower than in 2020. Despite the rapid rate of home construction and slightly slower household formations, the housing supply gap widened because once again, housing formations outpaced construction, exemplifying just how much construction is needed to catch up to demand.
Despite an Uptick in Building Activity, the Housing Supply Gap Widens
In 2021, an additional 1.57 million households formed, resulting in a total of 13.8 million new households between 2012 and 2021. In 2021, homebuilders started construction on about 1.12 million single-family homes, bringing the 2012 to 2021 housing starts total to 8 million homes. As household formations outpaced housing starts in 2021, the gap between these metrics widened to 5.82 million fewer housing starts than household formations between 2012 and 2021. This gap grew by about 600,000 homes between June and December 2021, despite decade-plus high levels of housing starts and completions.

This trend of underbuilding relative to household formation carries over to homeowner vacancy rates as well as rental vacancy rates. As households form and housing starts fail to keep pace, the number of vacant houses dwindle. Homeowner vacancy dropped from 2% in 2012 to 0.9% in 2021. Similarly, rental vacancy rates plummeted, reaching a low 5.6% in the fourth quarter of 2021.

Between 2015 and 2021, the average rate of household formation was 1.52 million households per year, while the average rate of housing starts was 889,000 homes per year. If building and household formations were to continue at this clip, the gap between these metrics would never close. Notably, in 2021, 1.57 million households were formed and 1.12 million homes were started, which is a sizable improvement over recent years, though it will still lead to an ever-widening gap. If the rate of housing starts doubled from the decade-plus high 2021 rate to an average rate of 2.2 million housing starts per year, it would still take over 7 years to close the existing gap assuming the 2021 household formation rate continues. The rate of home completions would have to be three times the 2021 rate (2.7 million homes completed per year) to keep up with demand and close the existing gap within 2-3 years.
Home Completions Lag Housing Starts
Notably, 2021 saw the largest gap between housing starts and housing completions due to ongoing supply chain issues. Between 2012 and 2020, housing starts ranged from 1.7% lower to 10.8% higher than home completions. In 2021, housing starts were 16.1% (156,000 units) higher than home completions, the largest gap between these metrics in 37 years. While both start and completion rates were higher than in the recent past, the gap between the two metrics means that some of the improvement we’ve seen in starts has yet to materialize into real relief for homebuyers.
In 2021, both housing starts and completions exceeded 2020 levels. Housing starts grew 13.4% in 2021 to a total of 1.1 million housing starts. Similarly, home completions grew 6% in 2021 to 967,000 completions. Coupled with a slightly slower rate of household formations, 2021 building rates enabled the smallest yearly gap between housing starts and household formations since 2016.
However, despite the uptick in housing starts, new residential construction data shows that a shrinking proportion of new homes are affordable (less than $300,000 sales price). In 2018 and 2019, 42% of new homes constructed were sold for less than $300,000. In 2020, this proportion dropped to 38%, and in 2021, only 25% of homes constructed were sold for less than $300,000.
Housing Permits Concentrated in the South and West
Housing permits give insight into future construction patterns in the US. In 2021, 58.1% of all single family home permits were granted in the South, and 22.9% were granted in the West. These trends have held relatively consistent since 2015, as an average of 55.7% and 23.9% of permits were granted in the South and West, respectively, between 2016 and 2020. According to Census population estimates, the South grew by 9.3% and the West by 8.7% between 2010 and 2019, compared to just 1.1% in the Northeast and 2.0% in the Midwest, warranting high levels of permitting and construction in the South and West. Notably, 46.3% more permits were issued nationwide in 2021 than in 2015, indicating a significant uptick in permitting in all regions.
At the metro-level, the top 10 large metros seeing outsized permitting relative to city size are in the South and West. These metros include Austin (TX), North Port (FL), Provo (UT), and Fort Myers (FL), along with four other Southern metros, and two Western metros. These trends align with sizable population growth in Southern and Western cities. Many cities within the highest-permitted metros are among the 15 Fastest-Growing Large Cities between 2010 and 2019, according to Census population estimates. The significant investment in these metros amplifies consumer preference for affordable locales that offer strong economies and plenty of space. This trend is expected to continue, as discussed in our recent 2022 Top Housing Markets Forecast.
Interestingly, many smaller cities are also seeing considerable investment relative to their size. Most of these smaller cities have the benefit of natural beauty, whether it be mountains (Missoula, MT; Greeley, CO) or beaches (Myrtle Beach, SC; Port St. Lucie, FL; Naples, FL).
Homebuilder Confidence Remains High
In the 2010-2021 time period, home builder sentiment climbed. In 2010, confidence was still recovering from the housing crash, but the next decade marked a period of confidence-boosting expansion. Even the disruption of the pandemic served to ultimately boost builder confidence to new all-time highs and to remain above pre-pandemic levels after the initial shock wore off. After homebuilder sentiment hit the lowest levels since 2012 in April 2020, it has been on a relatively steady upward trend, reaching an all-time high of 90 in November 2020. In 2021, homebuilder sentiment averaged 81, the highest average yearly sentiment on record, up 11 points from 2020. So far, homebuilder sentiment in January 2022 is tied with January 2021 at a value of 83. Homebuilder sentiment remained solidly optimistic for all of 2021, a trend that seems to be carrying into 2022 as home demand continues to be strong. Rising homebuilder sentiment suggests builders will continue to ramp up housing construction, which is a needed step toward closing the significant housing shortage.

Overall, the market is looking strong for buyers, builders and sellers alike. Slightly lower household formation in 2021 gave builders the opportunity to begin to catch up to demand. The pandemic served as an opportunity for reflection, pushing many homebuyers towards larger homes in lower cost cities which, coupled with work-from-home arrangements, allows for a broader home search into areas that may not have been feasible previously. As builders enjoy booming demand, buyers can look forward to improved inventory as the hot housing market benefits from both more building and more sellers attracted to the hot market.
Data:
- Household Formations (https://fred.stlouisfed.org/series/TTLHHM156N)
- Single-family housing starts (https://www.census.gov/construction/nrc/index.html)
- Metro-level residential permits (https://www.census.gov/construction/bps/msamonthly.html)
- Metro-level population (https://www.census.gov/data/tables/time-series/demo/popest/2010s-total-metro-and-micro-statistical-areas.html)
- Home builder sentiment (HMI) (https://www.nahb.org/news-and-economics/housing-economics/indices/housing-market-index)
- Homeowner vacancy rate (https://www.census.gov/housing/hvs/index.html)
- Housing Starts vs Completions (https://fred.stlouisfed.org/graph/?g=LCNQ)
Methodology:
To arrive at yearly household formation, the increase in households between December in the previous year and the current year were calculated. This value was used as the number of household formations in the current year. Home starts, completions and permits refer to the total single-family homes metric in the Census construction data. HMI and vacancy data were pulled and displayed as stated in the data source.
To understand how long it would take to close the gap between household formations and housing starts, the assumption was made that each projected year would see the yearly average number of household formations as assessed from 2017-2021, unless otherwise specified. The assumed base rate of home building was the 2021 average. Any reference to double or tripling the rate of homebuilding is referring to the 2021 average rate of home building.
In order to speak to the affordability of the homes being started and completed, the Census data on new home sales was used as a proxy. For years 2018-2020, $300,000 is below the median home price. This price was used as the upper end of affordability, considering anything less than $300,000 as ‘affordable’. To assess affordability, the relative proportion of home sales for less than $300,000 in each year, 2018-2021, was used.