Calculated Risk
By Bill McBride
The Economic Fireworks have been in Housing!
Pandemic economic outcomes were frequently largely unexpected.
For example, early in the pandemic, there was a shortage of toilet paper. Since there are two supply chains for toilet paper – one residential and the other commercial – and many more people were using the bathroom at home instead of at the office, there was a shortage of residential toilet paper. This led to some hoarding too and that exacerbated the shortage.
More generally, in 2020, we saw a surge in spending on goods as many services were shut down. With fiscal policy supporting incomes, the increase in demand for goods eventually led to an increase in prices as inventories were depleted.
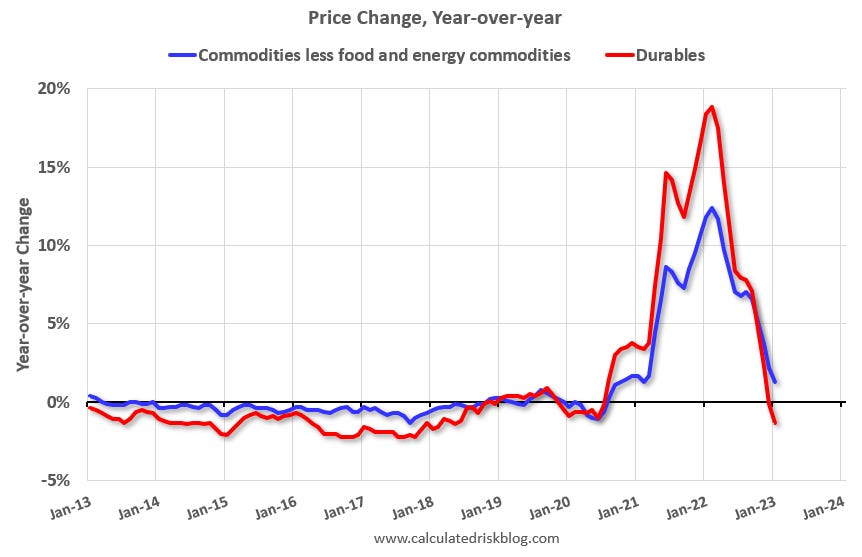
The graph above shows that goods prices started to increase year-over-year (YoY) in 2020 and accelerated in 2021 due to both strong demand and supply chain disruptions.
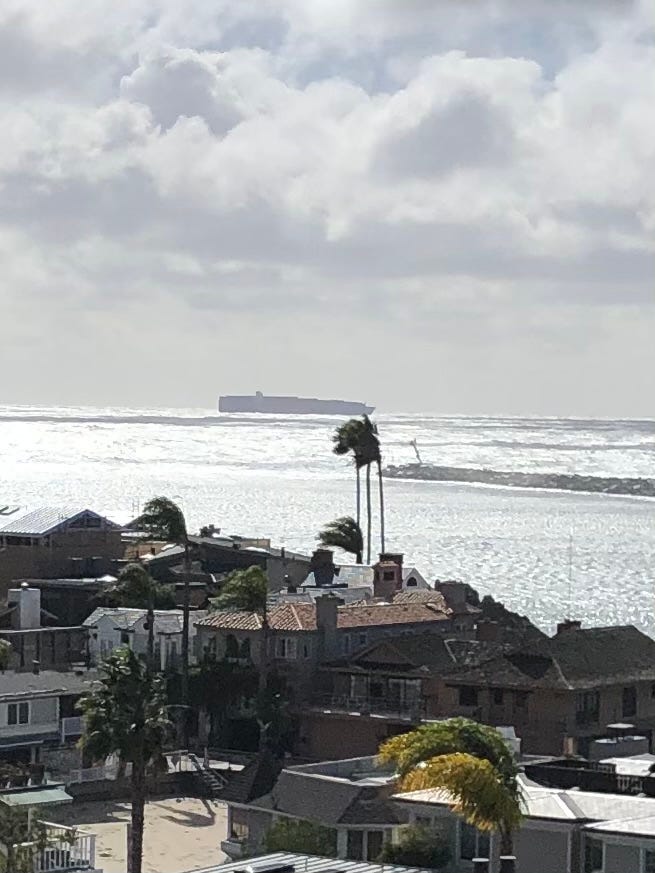
One of the impacts of the increased demand for goods was the large number of ships anchored off the California coast waiting to unload at the ports of Los Angeles and Long Beach. Here is a photo I took in January 2021 of a freighter anchored off of Newport Beach, CA – something we’d never seen before!
As prices soared in 2021, Fed Chair Jerome Powell argued that the increase in prices was transitory, and many analysts (including me) agreed. For example, in June 2021, Powell said:
Inflation has increased notably in recent months. This reflects, in part, the very low readings from early in the pandemic falling out of the calculation; the pass-through of past increases in oil prices to consumer energy prices; the rebound in spending as the economy continues to reopen; and the exacerbating factor of supply bottlenecks, which have limited how quickly production in some sectors can respond in the near term. As these transitory supply effects abate, inflation is expected to drop back toward our longer-run goal.
emphasis added
And – as the graph above shows – the surge in inflation for goods and commodities was transitory.
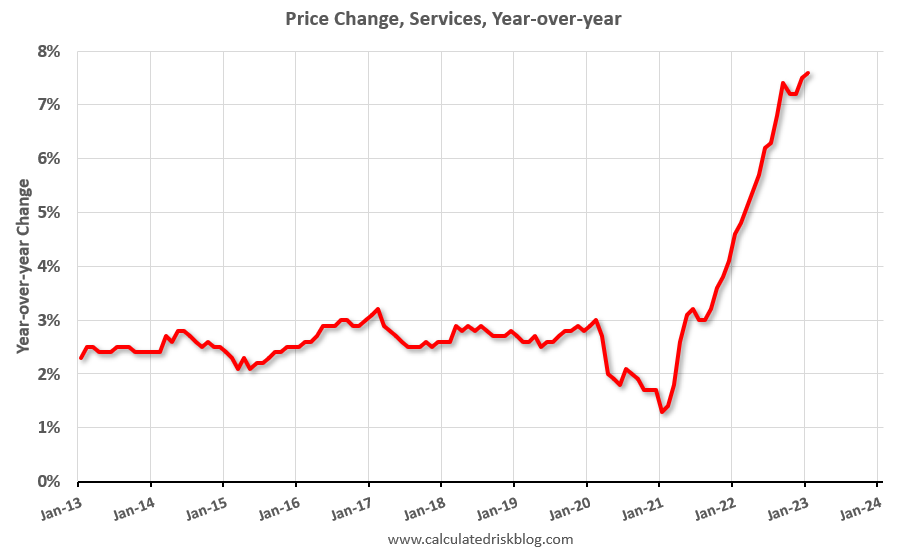
However, in 2021 and 2022, we saw a shift from goods back to services. And in February 2022, Russia invaded Ukraine, pushing up food and energy prices and further disrupting supply chains (and more importantly causing extreme human hardship).
The second graph shows the YoY price change for services through January 2023. Services were up 7.6% YoY as of January 2023.
The FOMC was slow to react to the increase in service prices and waited to raise rates until March 2022. Since then, the FOMC has raised rates significantly, and the target range for the federal funds rate is currently at 4-1/2 to 4-3/4 percent.
In his testimony recently, Fed Chair Powell clearly doesn’t see service inflation as transitory:
That said, there is little sign of disinflation thus far in the category of core services excluding housing, which accounts for more than half of core consumer expenditures. To restore price stability, we will need to see lower inflation in this sector, and there will very likely be some softening in labor market conditions.
… the latest economic data have come in stronger than expected, which suggests that the ultimate level of interest rates is likely to be higher than previously anticipated. If the totality of the data were to indicate that faster tightening is warranted, we would be prepared to increase the pace of rate hikes. Restoring price stability will likely require that we maintain a restrictive stance of monetary policy for some time.
emphasis added
Clearly Powell believes service-related price increases will not as transitory as goods and commodities and will require “some softening in labor market conditions”. The FOMC is clearly committed to further raising rates to curb inflation.
The Economic Fireworks have been in Housing!
Although the pandemic caused numerous economic disruptions – above was just a brief overview – the real fireworks were in the housing market.
At the onset of the pandemic, demand initially collapsed, and then a combination of factors led to a surge in demand for purchasing homes. These included fiscal policies supporting incomes, the FOMC lowering the federal funds rate to close to zero and increasing its balance sheet (aka QE: quantitative easing), a large cohort moving into their 30s, and strong demand for 2nd homes to escape the large cities during the pandemic.
The actions of the FOMC pushed down 30-year mortgage rates into the high 2s, and this also led to easy borrowing for investors. Here is a graph of mortgage rates from mortgagenewsdaily.com. Note that 30-year rates were close to 4% prior to the pandemic.

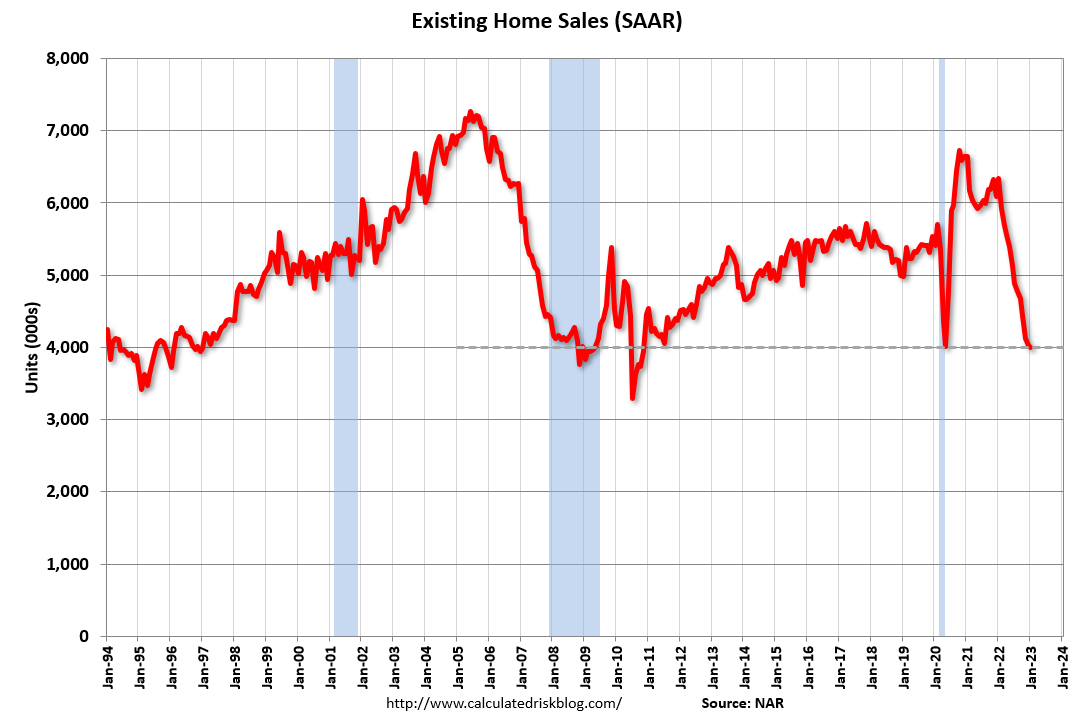
Meanwhile, many potential home sellers kept their homes off the market to avoid the virus. Demand surged, and supply was limited, so prices soared. Here are three graphs to illustrate what happened, first on sales from the National Association of Realtors® (NAR) – note that sharp increase in demand in the 2nd half of 2020 that continued until early 2022.
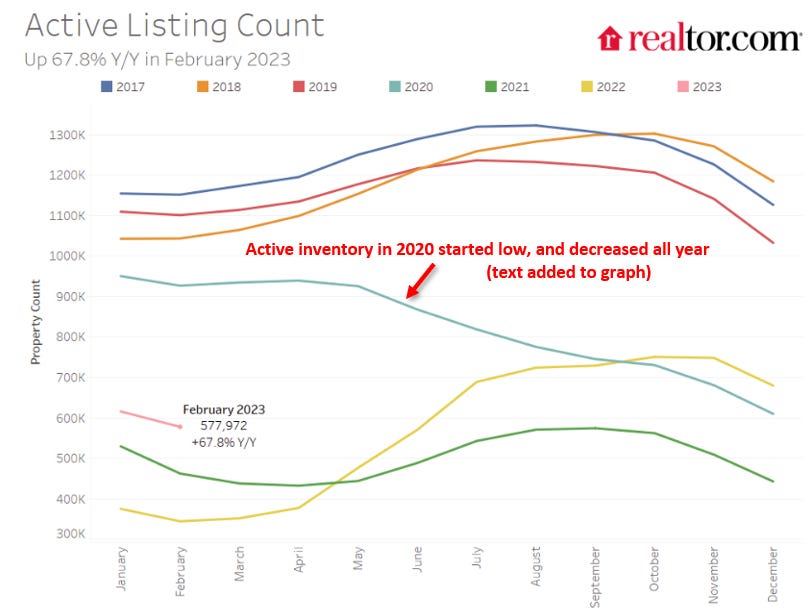
The next graph is from Realtor.com and shows active inventory over the last several years. Active inventory started fairly low in 2020 and didn’t increase seasonally following the onset of the pandemic.
And with surging demand and limited supply, prices soared. Here is a graph of the year-over-year change in prices from Case-Shiller:
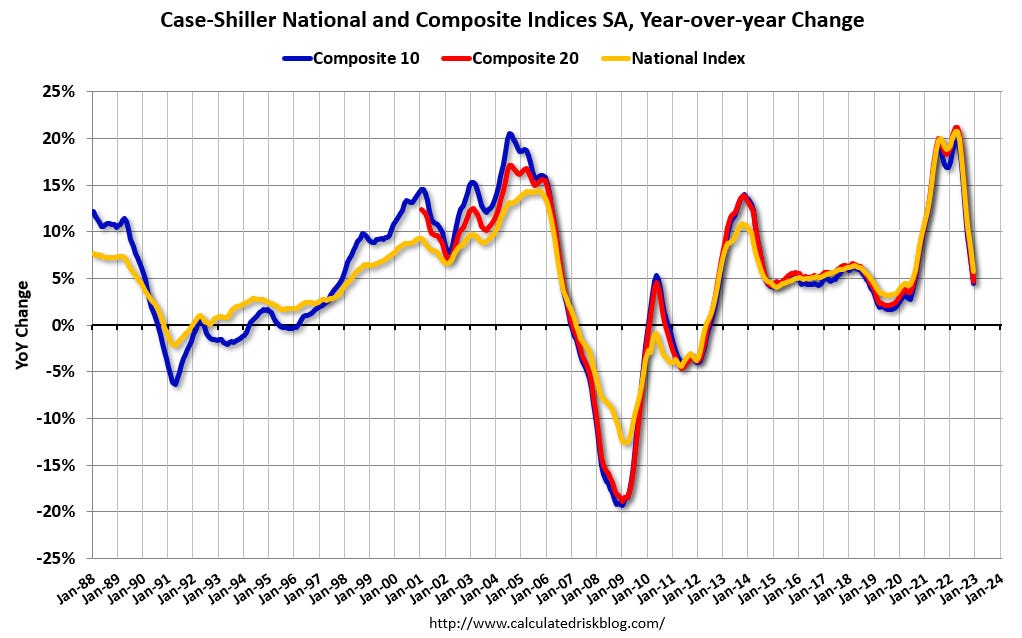
According to Case-Shiller, national house prices increased 40% over a two-year period from June 2020 to June 2022!
The next pandemic related housing surprise was the surge in rents that started in 2021. Here is a graph of the year-over-year change in rents for several measures:
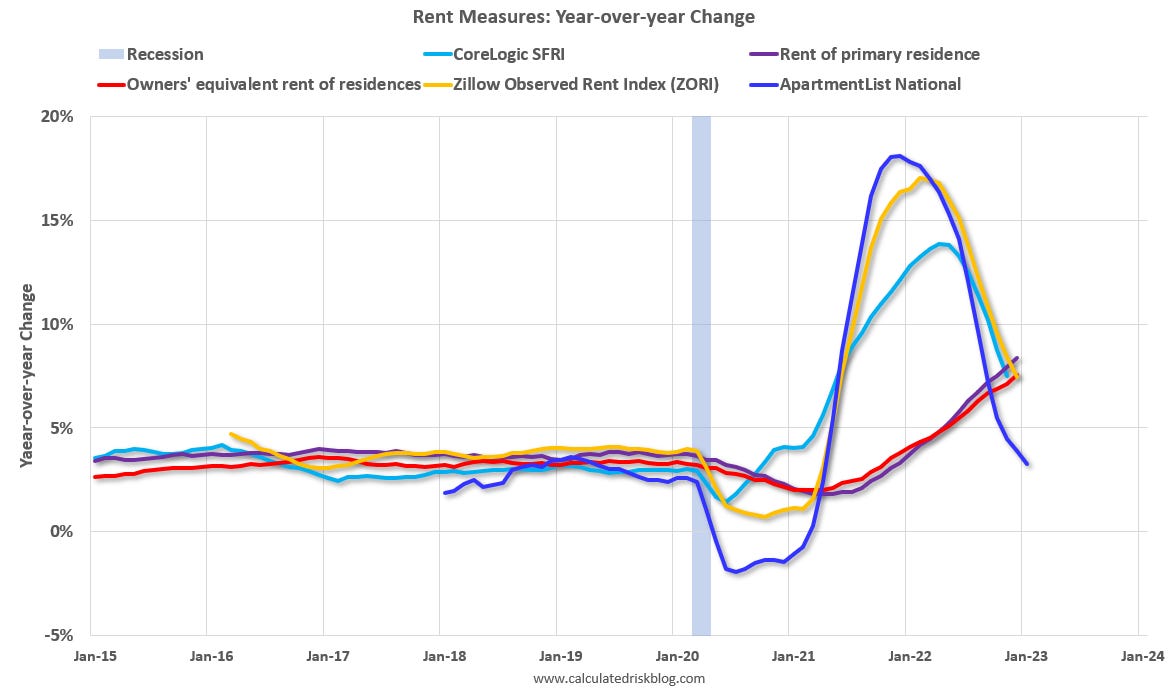
I noted this increase in 2021, and correctly deduced that there was a surge in household formation, and that some of the demand was from roommates separating (among other factors). See from 2021: Household Formation Drives Housing Demand. Data released since then has shown that the surge in household formation was largely driven by roommates splitting up due to work-from-home.
More recently household formation has slowed sharply.