CALCULATEDRISK
By Bill McBride
This 2-part overview for mid-April provides a snapshot of the current housing market.
I always like to start with inventory, since inventory usually tells the tale! And currently inventory is increasing year-over-year but is still well below pre-pandemic levels.
New Listings for Existing Homes Up Year-over-year in February
Here is a graph of new listing from Realtor.com’s March 2024 Monthly Housing Market Trends Report showing new listings were up 15.5% year-over-year in March. New listings still well below pre-pandemic levels.From Realtor.com:
However, providing a boost to overall inventory, sellers turned out in higher numbers this March as newly listed homes were 15.5% above last year’s levels. This marked the fifth month of increasing listing activity after a 17-month streak of decline.
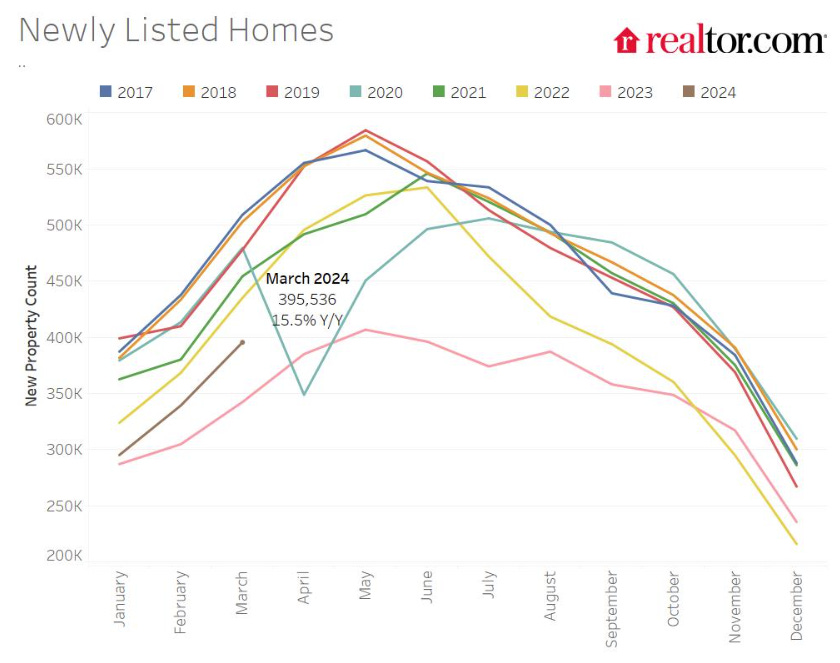
Note the seasonality for new listings. December and January are seasonally the weakest months of the year for new listings, followed by February and November. New listings will be up year-over-year in 2024, but still below normal levels.
There are always people that need to sell due to the so-called 3 D’s: Death, Divorce, and Disease. Also, in certain times, some homeowners will need to sell due to unemployment or excessive debt (neither is much of an issue right now).
And there are homeowners who want to sell for a number of reasons: upsizing (more babies), downsizing, moving for a new job, or moving to a nicer home or location (move-up buyers). It is some of the “want to sell” group that has been locked in with the golden handcuffs over the last couple of years, since it is financially difficult to move when your current mortgage rate is around 3%, and your new mortgage rate will be in the 6 1/2% to 7 1/2% range.
But time is a factor for this “want to sell” group, and eventually some of them will take the plunge. That is probably why we are seeing more new listings now.
Impact on Active Inventory
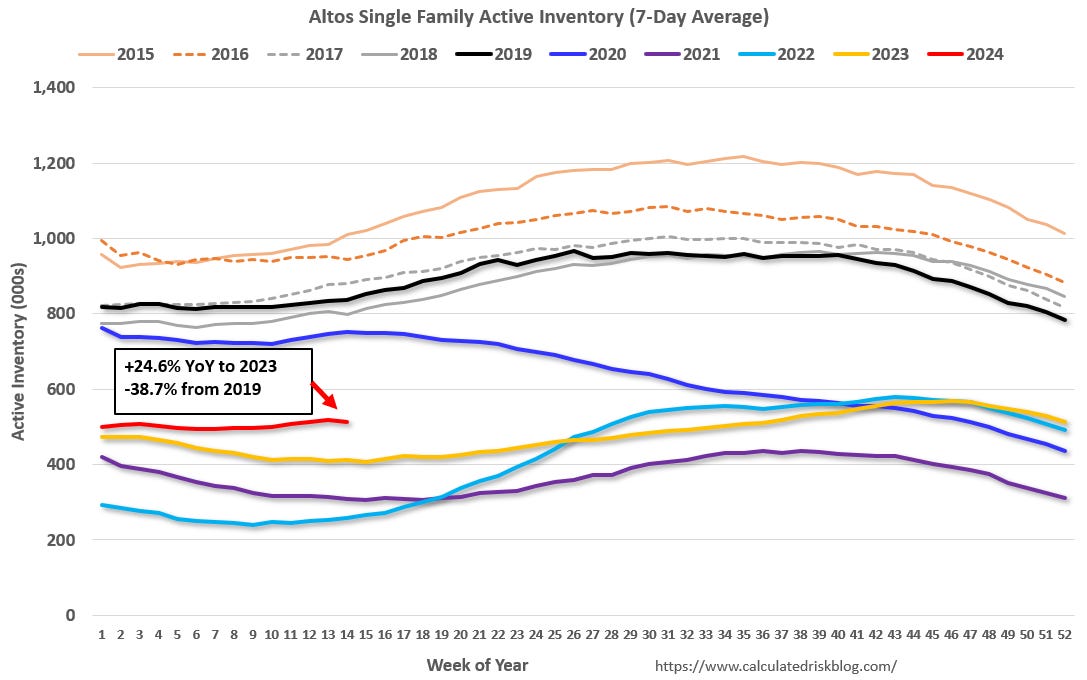
The following graph shows the seasonal pattern for active single-family inventory since 2015 through April 5, 2024, from Altos Research. The red line is for 2024. The black line is for 2019.
Note that inventory is up almost double from the record low for the same week in 2022, but still well below normal levels.
Inventory was up 24.6% compared to the same week in 2023 (last week it was up 26.0%), and down 38.7% compared to the same week in 2019 (last week it was down 37.9%). Inventory declined last week due to the Easter holiday.
Back in June 2023, inventory was down almost 54% compared to 2019, so the gap to more normal inventory levels has closed a little.
And here is a monthly graph of active inventory from Realtor.com. In March, active inventory was up 23.5% year-over-year.
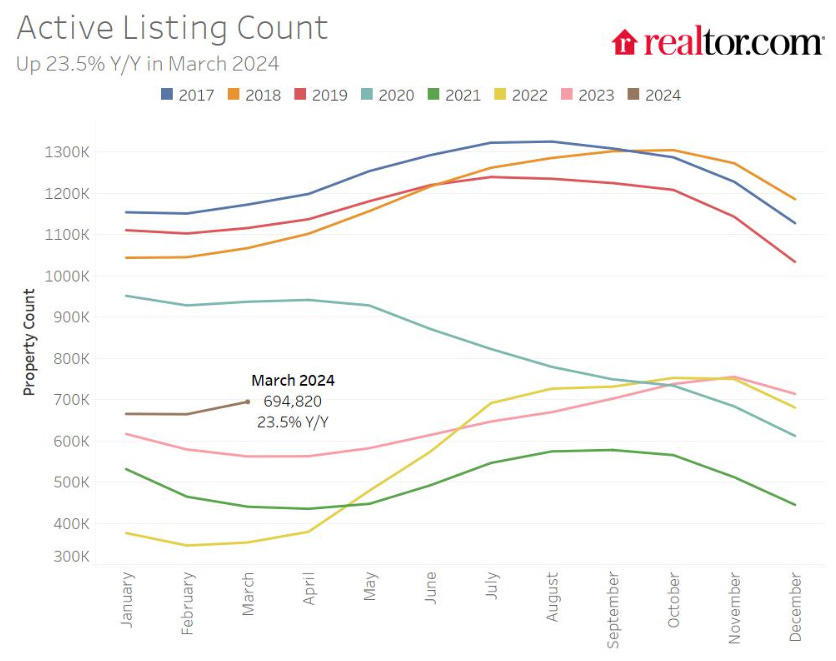
Months-of-supply is important to watch, and it is possible months-of-supply will be back to 2019 levels later this year.
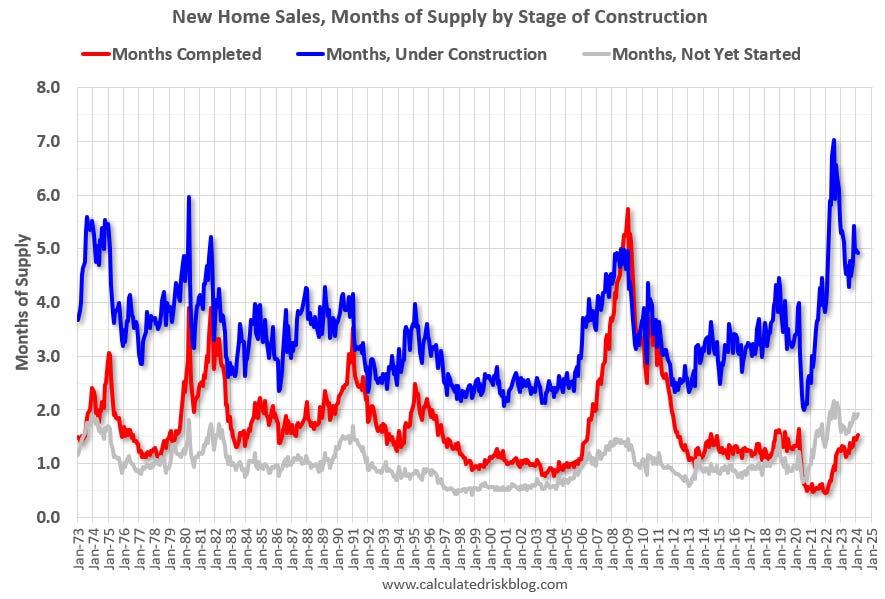
New Home Inventory Under Construction Remains Elevated
For new homes, there are almost 5 months of homes are under construction (blue line below) – well above the normal level. There are 1.5 months of completed supply (red line). This is close to the normal level.
New home inventory is close to a record percentage of total inventory. The following graph uses Not Seasonally Adjusted (NSA) existing home inventory from the National Association of Realtors® (NAR) and new home inventory from the Census Bureau (only completed and under construction inventory).
Note: Mark Fleming, Chief Economist at First American pointed this out in March 2023.
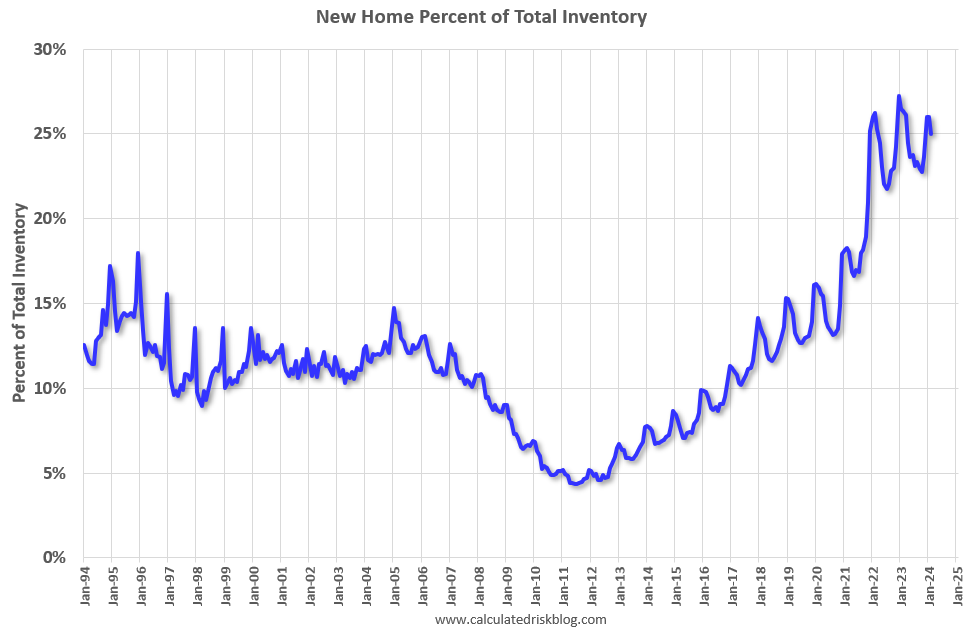
It took a number of years following the housing bust for new home inventory to return to the pre-bubble percent of total inventory. Then, with the pandemic, existing home inventory collapsed and now the percent of new homes is 25.0% of the total for sale inventory, down from a peak of 27.2% in December 2022. The percent of new homes of total inventory should decline this year as existing home inventory increases in 2024.
Note that the lack of existing home inventory, and few distressed sales, has been a positive for homebuilders.
And for housing starts there are a near record number of multi-family housing units under construction, and a near record 1.666 million total units under construction. Multi-Family housing units under construction has peaked!
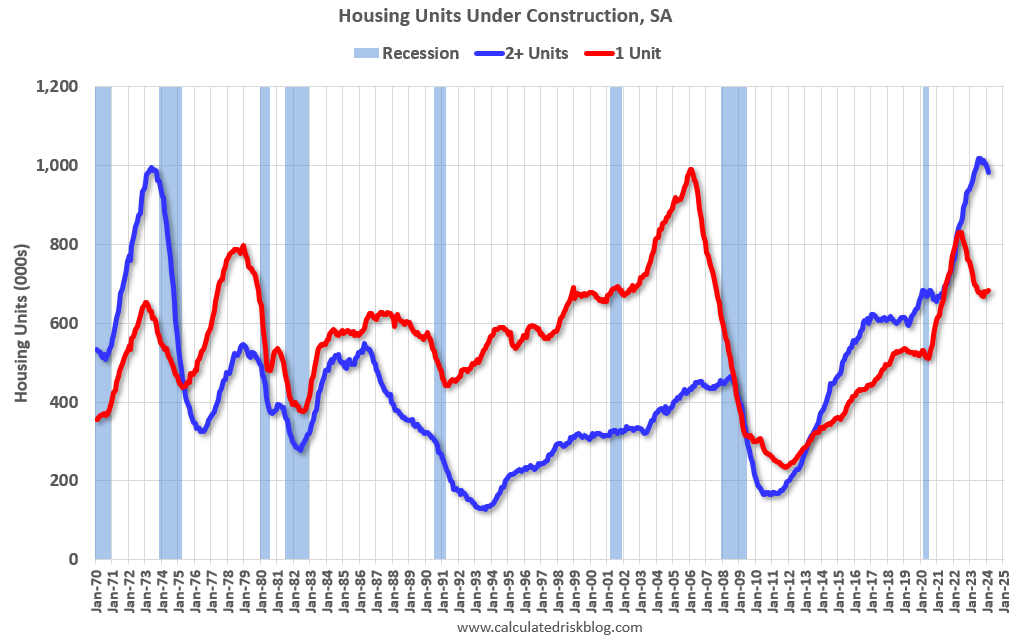
Red is single family units. Currently there are 683 thousand single family units (red) under construction (SA). This was up in February compared to January, and 148 thousand below the pandemic peak in May 2022. Blue is for 2+ units. Currently there are 966 thousand multi-family units under construction. This is 35 thousand below the record set in July 2023 of 1,018 thousand.
Combined, there are 1.666 million units under construction, just 44 thousand below the all-time record of 1.710 million set in October 2022.
Sales
The NAR reported sales were at a “seasonally adjusted annual rate of 4.38 million in February. Year-over-year, sales slid 3.3% (down from 4.53 million in February 2023).” This was close to the local markets I tracked for February.
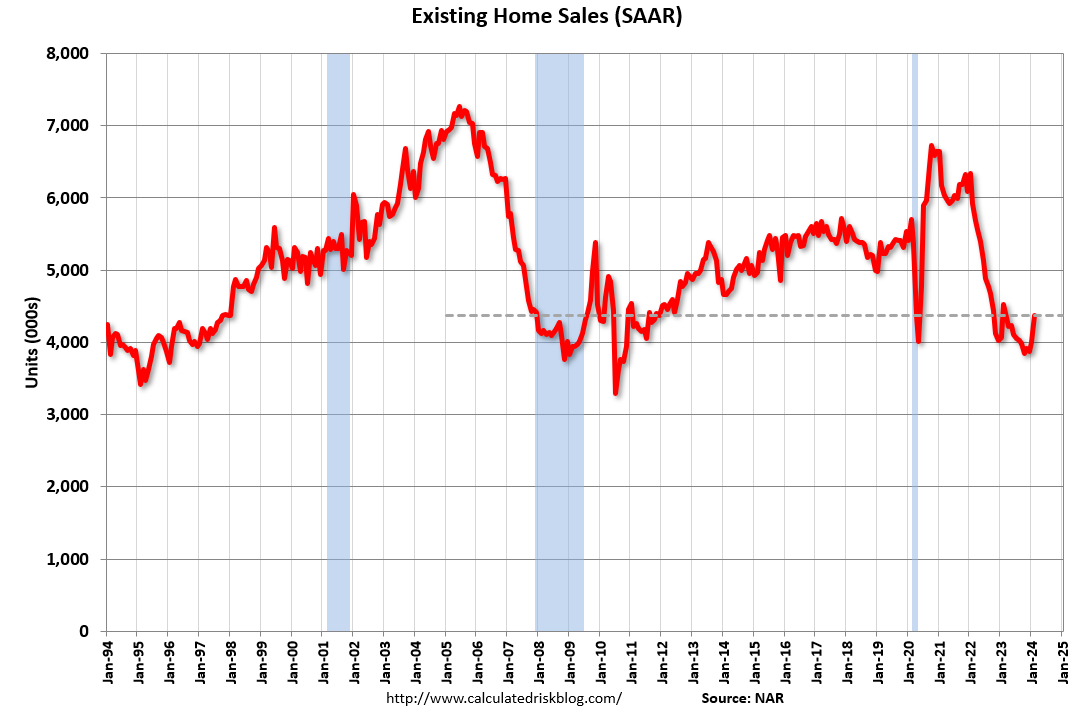
Early local market data for March suggests that the March existing home sales report will likely show a decrease from the February rate.
And the Census Bureau reported “Sales of new single‐family houses in February 2024 were at a seasonally adjusted annual rate of 662,000”, up 5.9% YoY from February 2023.
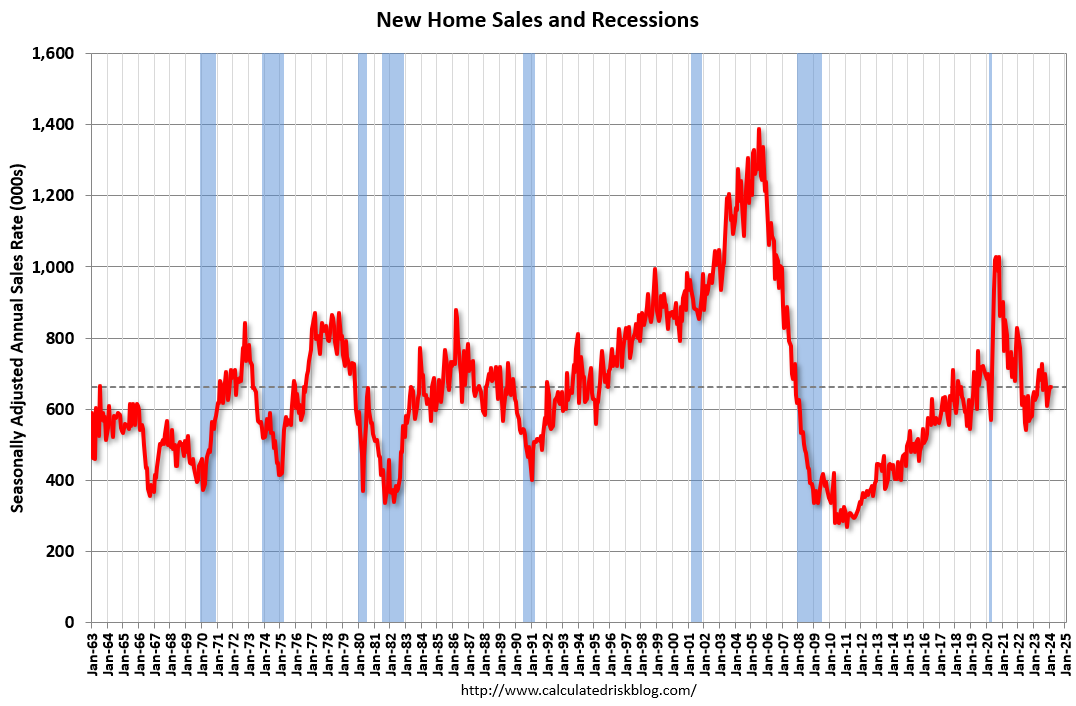
New home sales bottomed in July 2022. New home sales are holding up better than existing home sales due to the lack of existing home inventory and the lack of distressed sales this cycle – and new home builders are using various tools to attract buyers such as mortgage rate buydowns.
2024 Outlook
In December I posted some questions on my blog for 2024: Ten Economic Questions for 2024. Some of these questions concern real estate (inventory, house prices, housing starts, new home sales), and I’ve posted thoughts on those in the newsletter.
So far, the outlook remains the same: Existing home inventory will likely increase in 2024 but remain well below normal levels. Multi-family starts will likely decline further – although completions will increase.
Here were my thoughts at the beginning of 2024:
• Question #8 for 2024: How much will Residential investment change in 2024? How about housing starts and new home sales in 2024?
“My guess is multi-family starts will decline further in 2024, likely down 25% or so year-over-year. Single family starts will likely be mostly unchanged year-over-year, putting total starts down close to 10%. I expect New Home sales to be up around 5% YoY.”
• Question #10 for 2024: Will inventory increase further in 2024?
“Somewhat lower mortgage rates – and time – will likely lead to more new listings in 2024. Still, mortgage rates will remain well above the pandemic lows, and therefore new listings will be depressed again in 2024.
The bottom line is inventory will probably increase year-over-year in 2024. However, it seems unlikely that inventory will be back up to the 2019 levels.”
In Part 2, I’ll discuss house prices, rents, mortgage rates, and more.