CALCULATEDRISK
By Bill McBride
This 2-part overview for mid-April provides a snapshot of the current housing market.
At this moment, we can’t talk housing without mentioning the overall economy.
Just over two weeks ago, I revised down my outlook for housing this year. Since then, policy and the outlook have taken a turn for the worse. One point I made in March was:
And another factor is the recent stock market volatility. Ten percent corrections are common, a further sell-off will have a negative wealth effect for potential home buyers.
Stock markets are now down around 20% (with crazy volatility). And it is likely this will negatively impact home sales.
On my blog, I went on Recession Watch over the weekend (not predicting a recession yet because the U.S. economy is very resilient, was on solid footing at the beginning of the year, and the tariffs might be lowered or reversed). And I discussed some of the data I’ll be watching in Recession Watch Metrics.
And on housing: Inventory, inventory, inventory! Inventory is increasing sharply, and inventory usually tells the tale.
New Listings for Existing Homes Up Year-over-year in March
Realtor.com reports in March 2025 Monthly Housing Market Trends Report that new listings were up 10.2% year-over-year in March. However, new listings are still well below pre-pandemic levels.From Realtor.com:
There was some positive news for inventory: newly listed homes rose 10.2% year-over-year in March, up from February’s 5.1% gain. That makes it the most active March for new listings in three years. While mortgage rates are still elevated, it’s possible that some homeowners are deciding they can’t wait any longer, choosing to list now rather than hold out for a major drop in mortgage rates.
And active listings were up 28.5% year-over-year.
Buyers had more homes to choose from this March, with the number of homes actively for sale up 28.5% compared to the same time last year. That marks the 17th month in a row of year-over-year inventory growth and a slight improvement over February’s gain of 27.5%. Still, even with this progress, housing inventory remains 20.2% below typical levels seen between 2017 and 2019, showing that the market still has catching up to do.
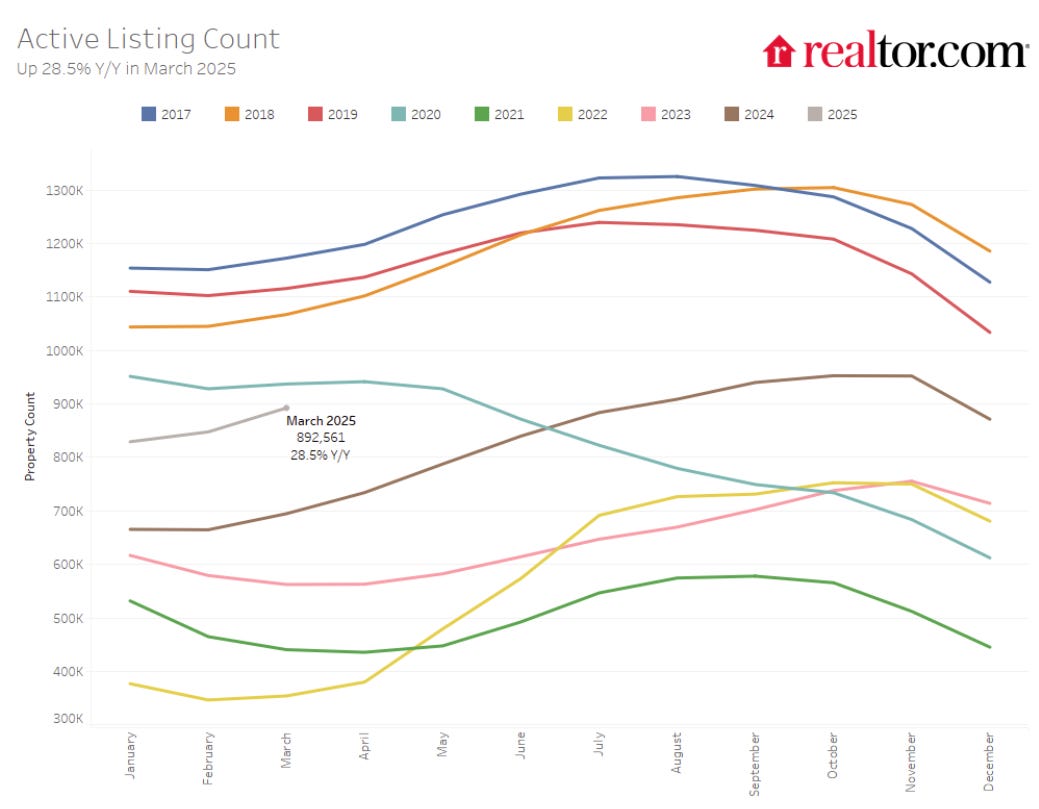
Note the seasonality for active listings. The next few months will be the key for inventory.
The following graph shows the seasonal pattern for active single-family inventory since 2015 through April 4, 2025, from Altos Research. The red line is for 2025. The black line is for 2019.
Inventory was up 34.7% compared to the same week in 2024 (last week it was up 30.6%), and down 17.4% compared to the same week in 2019 (last week it was down 19.0%).
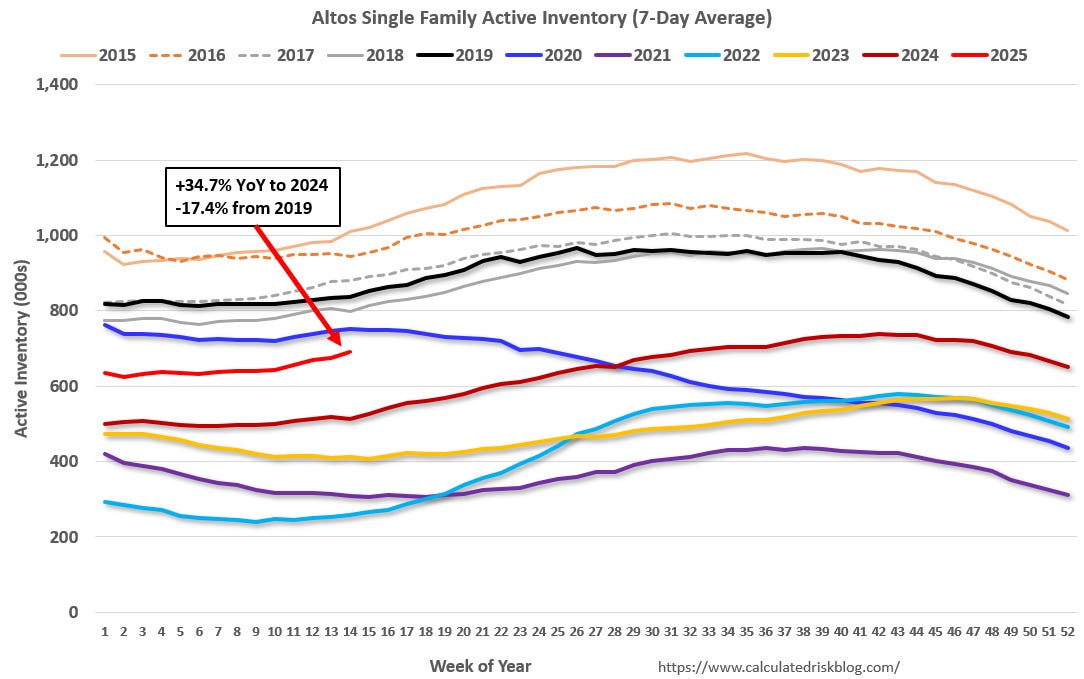
Inventory will pass 2020 levels soon, and it now appears inventory will be close to 2019 levels towards the end of 2025.
Months-of-Supply
Since both inventory and sales have fallen significantly, a key for house prices is to watch months-of-supply. The following graph shows months-of-supply since 2017 using data from the NAR. Note that months-of-supply is higher than 6 of the last 8 years.
Months-of-supply was at 3.5 months in February compared to 3.6 months in February 2019. It appears national months-of-supply will be above pre-pandemic levels this summer, and likely above 5.0 months (putting some pressure on prices).
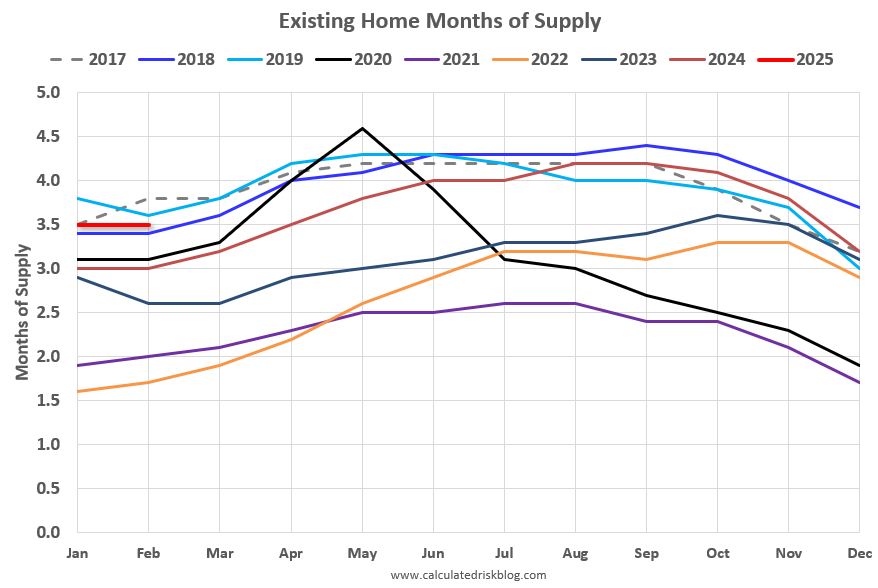
Inventory would probably have to increase to 5 1/2 to 6 months of supply to see national price declines again.
In 2022, we saw some price declines at the National level even with fairly low months-of-supply – probably due to the sharp increase in inventory and some sellers panicking while remembering the housing bust!
There are significant regional differences in months-of-supply. Here is a table of the local markets I follow for February 2025. Note: For February, I broke out Miami (Miami-Dade) from the “Miami Area” this also includes Broward County and Palm Beach.
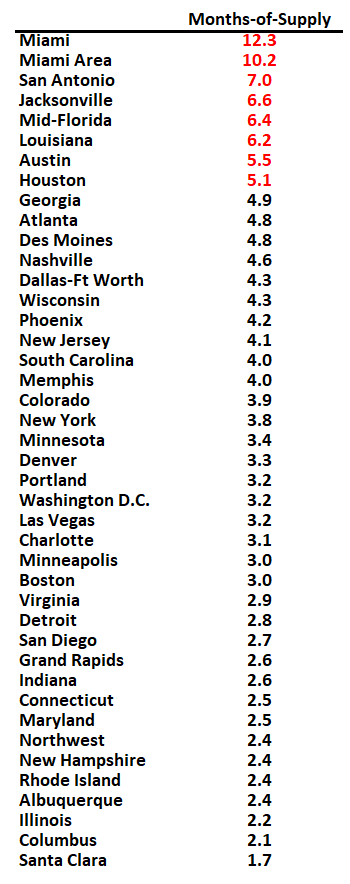
Months in red will likely see 6+ months of supply this summer and might see price pressures. There is nothing magical about 6 months; some areas see price declines with less inventory, some more. Florida and Texas are the most at risk states for price declines in 2025.
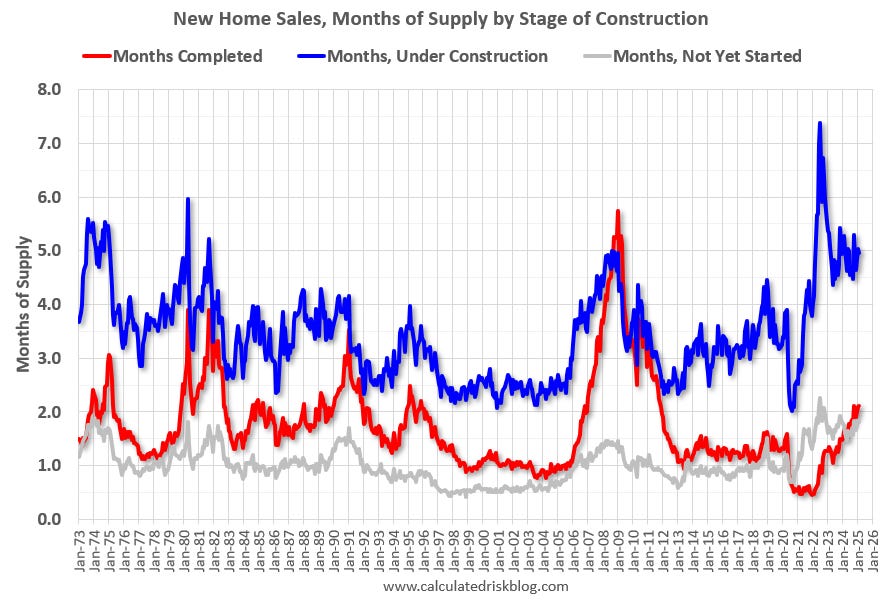
5 Months of New Home Unsold Inventory Under Construction; 2.1 Months Completed Supply
For new homes, there are 5.0 months of homes are under construction (blue line below) – generally declining, but still well above the normal level. There are 2.1 months of completed supply (red line). This is above the normal level.
New home inventory, as a percentage of total inventory, is still very high. The following graph uses Not Seasonally Adjusted (NSA) existing home inventory from the National Association of Realtors® (NAR) and new home inventory from the Census Bureau (only completed and under construction inventory).
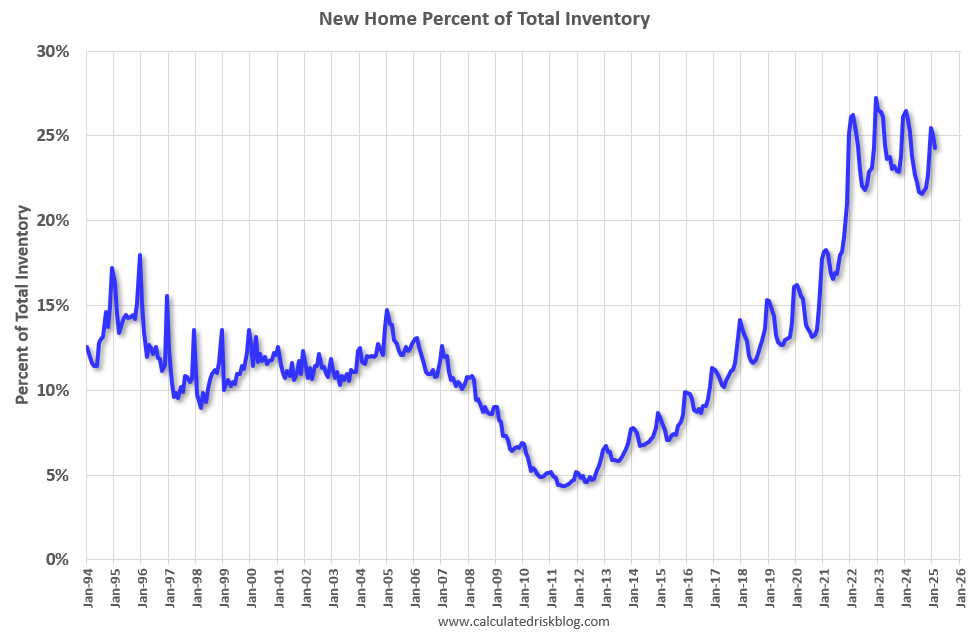
It took a number of years following the housing bust for new home inventory to return to the pre-bubble percent of total inventory. Then, with the pandemic, existing home inventory collapsed and now the percent of new homes is 24.3% of the total for sale inventory, down from a peak of 27.2% in December 2022.
The percent of new homes of total inventory should continue to decline as existing home inventory increases.
And for housing starts there are still an above normal number of multi-family housing units under construction, and 1.412 million total units under construction. However, multi-family housing units under construction is now declining rapidly.
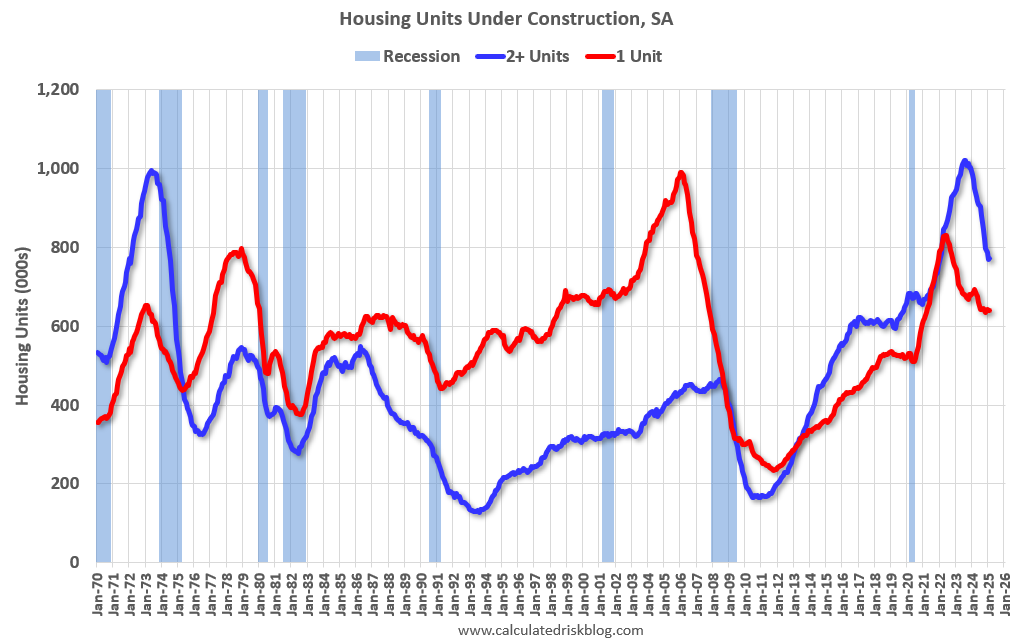
Currently there are 640 thousand single family units (red) under construction (SA). And there are 772 thousand multi-family units (blue) under construction. Combined, there are 1.412 million units under construction, 299 thousand below the all-time record of 1.711 million set in October 2022.
In the three years prior to the pandemic, there were about 1.1 to 1.2 million housing units under construction – so the current level is still historically high.
Sales
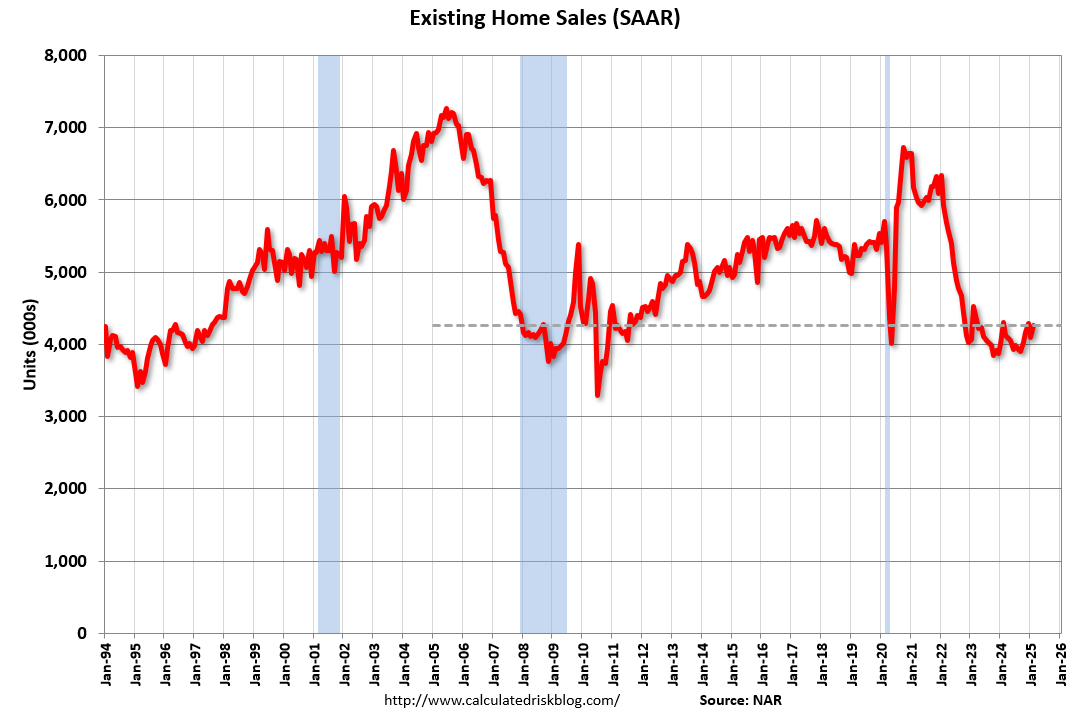
The NAR reported sales were at a “seasonally adjusted annual rate of 4.26 million in February”. As expected, existing home sales were down year-over-year following four consecutive months with sales up YoY. This decline was a combination of solid sales in February 2024 and slightly higher mortgage rates in December in January when contracts were signed (Existing home sales are reported at closing).
Early local market reports suggest existing home sales will down from February and likely down year-over-year again in March.
And for new home sales, the Census Bureau reported “Sales of new single-family houses in February 2025 were at a seasonally adjusted annual rate of 676,000”, up 5.1% YoY from February 2024.
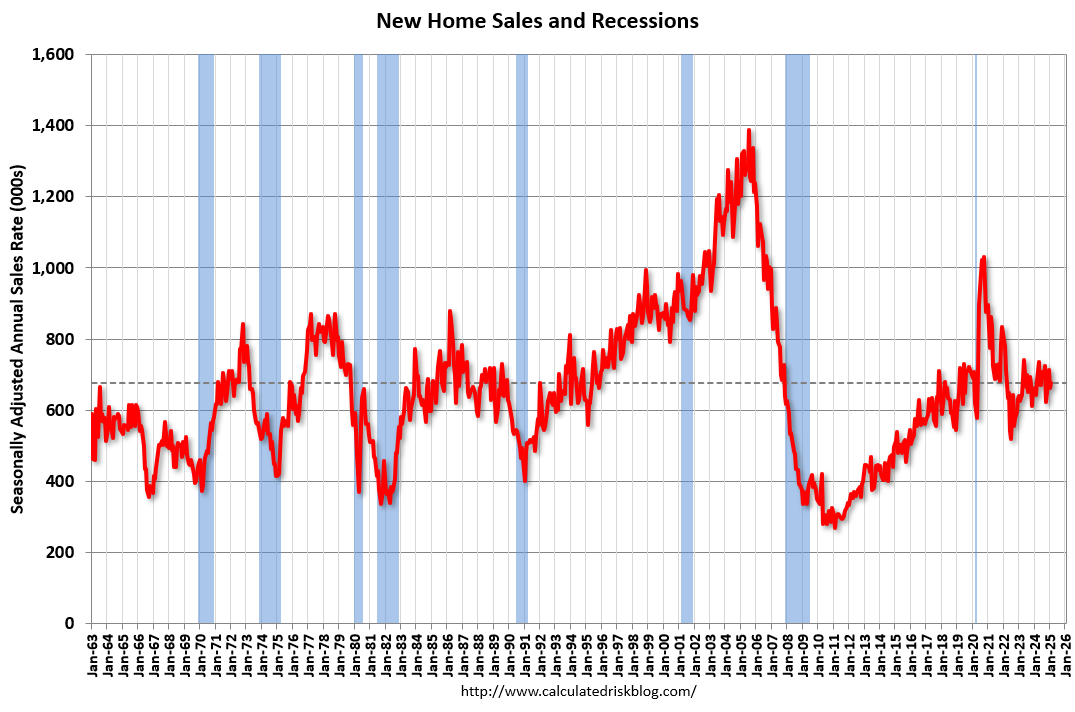
New home sales bottomed in July 2022 and new home sales have held up better than existing home sales due to the lack of existing home inventory and the lack of distressed sales this cycle – and new home builders have used various tools to attract buyers such as mortgage rate buydowns.
However, existing home inventory is increasing, and construction costs are rising, so the story for the homebuilders has changed.
A key for house prices will be to watch existing home months-of-supply!
In Part 2, I’ll review house prices, rents, mortgage rates, and more.