CALCULATED RISK
By Bill McBride
In this 2-part overview of the housing market for mid-April, I’ll discuss new and existing home inventory and sales, house prices, mortgage rates, rents and more.
New Listings Near Pandemic Low for April
Here is a graph of new listing from Realtor.com’s April 2023 Monthly Housing Market Trends Report showing new listings were down about 21% year-over-year in April. New listings are near the pandemic low for April, the year-over-year decline was slightly larger in April than in March. From Realtor.com:
In April, the number of homes newly-listed for sale declined by 21.3% compared to the same time last year. This was a slightly higher rate of decline than March’s 20.1% decrease and new listings remained 29.7% below pre-pandemic 2017 to 2019 levels.
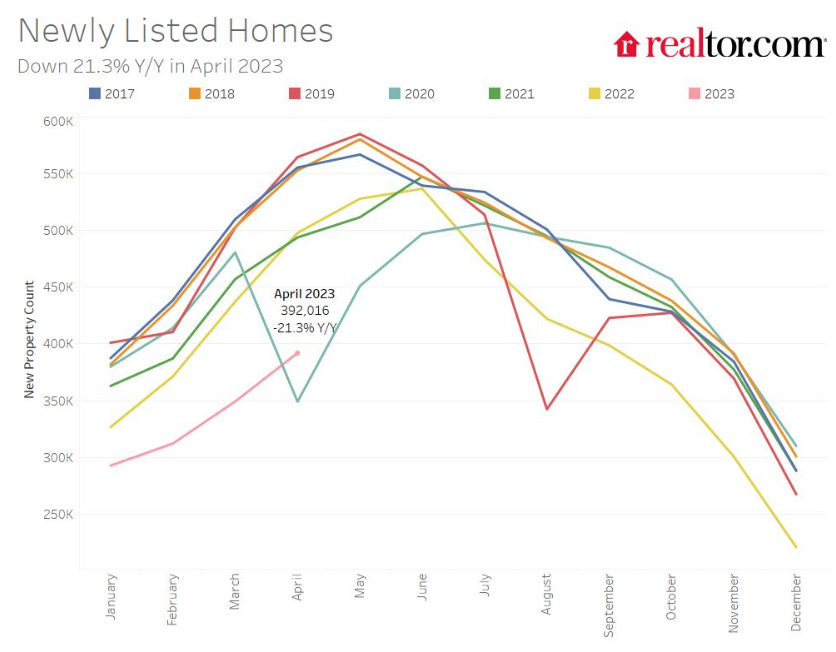
For the local markets I track that have reported so far, are show new listings were down more in April than in March.
For these areas, new listings were down 27.7% YoY. … Last month, new listings in these markets were down 20.3% YoY.
Impact on Active Inventory
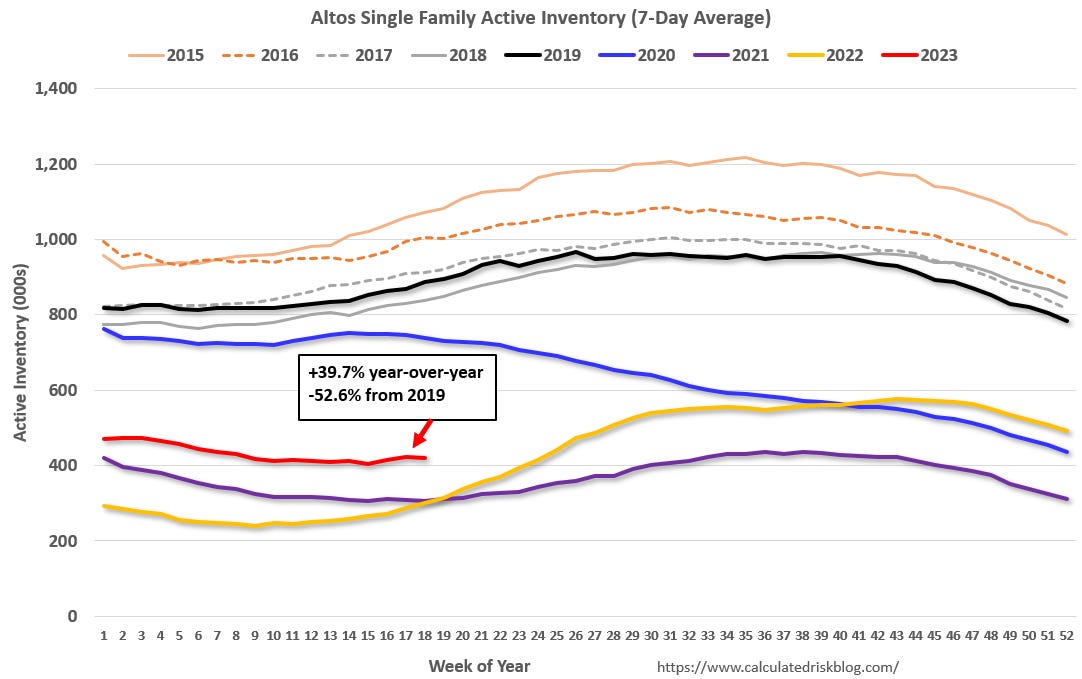
The following graph shows the seasonal pattern for active single-family inventory since 2015 from Altos Research. The red line is for 2023. The black line is for 2019.
Single-family active existing home inventory was up 39.7% compared to the same week in 2022, and down 52.6% compared to the same week in 2019. It appears inventory bottomed seasonally in mid-April but hasn’t increased significantly since then. It seems likely inventory will be down year-over-year in a few months!
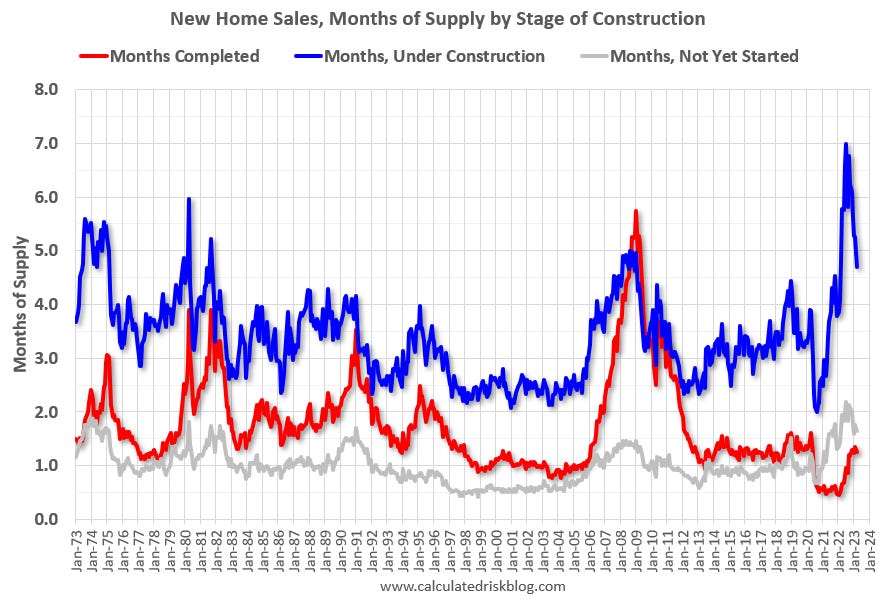
For new homes, there are almost 5.0 months of homes under construction (blue line below) – well above the normal level. This elevated level of homes under construction is due to supply chain constraints. There are 1.25 months of completed supply (red line). This is close to the normal level.
Interestingly, new home inventory is essentially at a record percentage of total inventory. This graph uses Not Seasonally Adjusted (NSA) existing home inventory from the National Association of Realtors® (NAR) and new home inventory from the Census Bureau (only completed and under construction inventory).
Note: Mark Fleming, Chief Economist at First American pointed this out in March.
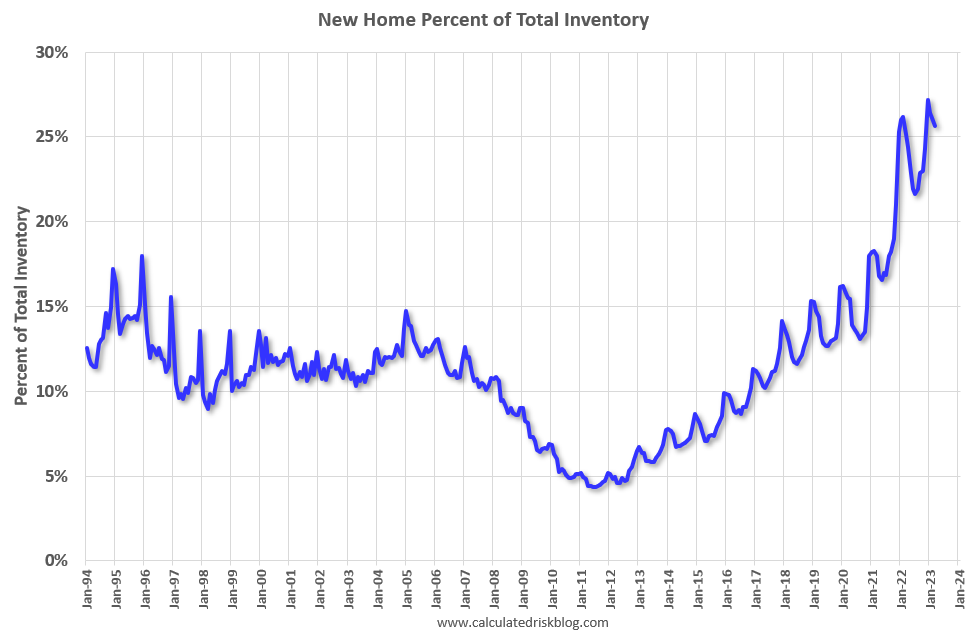
It took a number of years following the housing bust for new home inventory to return to the pre-bubble percent of total inventory. Then, with the pandemic, existing home inventory collapsed and now the percent of new homes is over 25% of total for sale inventory. The lack of existing home inventory, and few distressed sales, has been a positive for homebuilders.
And for housing starts there are a near record 1.69 million units under construction.
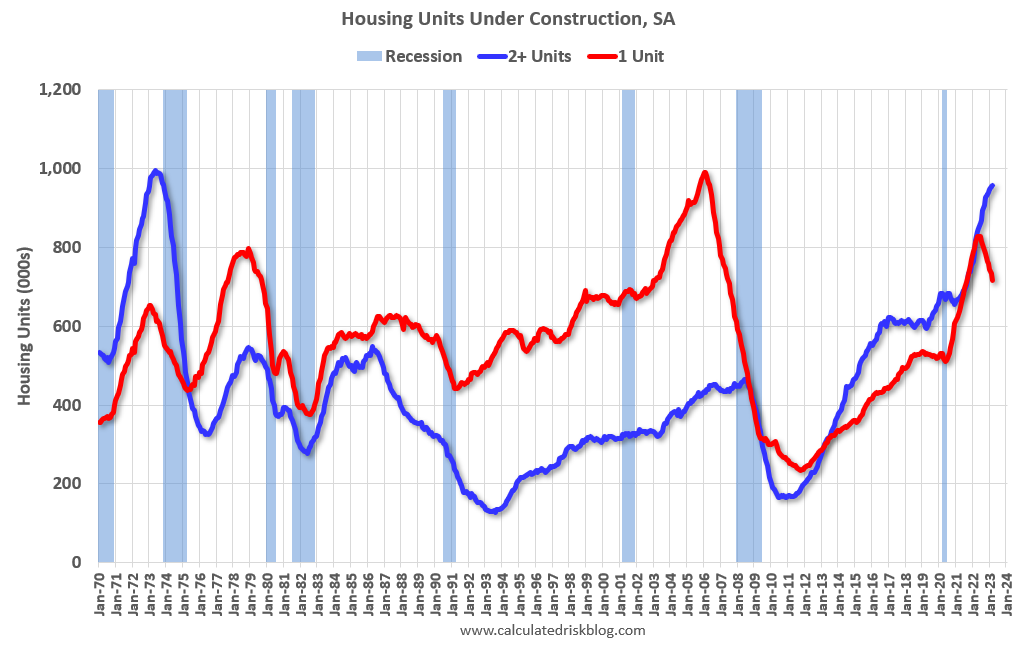
Red is single family units. Currently there are 716 thousand single family units (red) under construction (SA). This is 112 thousand below the recent peak in April and May. Single family units under construction have peaked since single family starts are now declining. Blue is for 2+ units. Currently there are 958 thousand multi-family units under construction. This is the highest level since November 1973!
Combined, there are 1.674 million units under construction, just 37 thousand below the all-time record of 1.711 million set in October 2022.
Sales
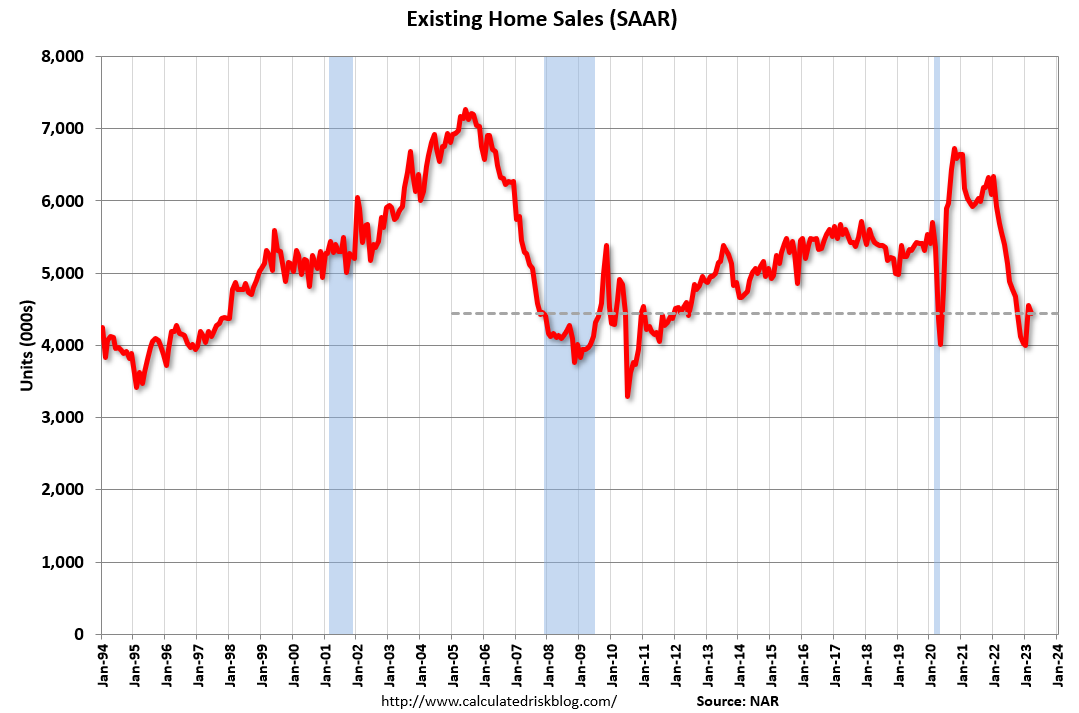
We have seen declines in both new and existing home sales due to higher mortgage rates. The NAR reported sales were at a “seasonally adjusted annual rate of 4.44 million in March. Year-over-year, sales waned 22.0% (down from 5.69 million in March 2022).” This was in line with the local markets I track for March.
The early local market reports suggest a larger year-over-year decline in closed sales NSA in April, although there was one less selling day in April this year compared to April 2022.
It is possible that existing home sales, seasonally adjusted, bottomed in December and January. But a bottom in existing home sales doesn’t mean other measures are near a bottom. There are usually two bottoms for housing.
[T]here will be two bottoms for housing: one for activity and the other for prices. Existing home sales may have already bottomed, but we will see further declines in residential investment. Prices – especially in real terms – will be under pressure for some time.
And the Census Bureau reported “Sales of new single‐family houses in March 2023 were at a seasonally adjusted annual rate of 683,000”, down just 3.4% YoY from March 2022.
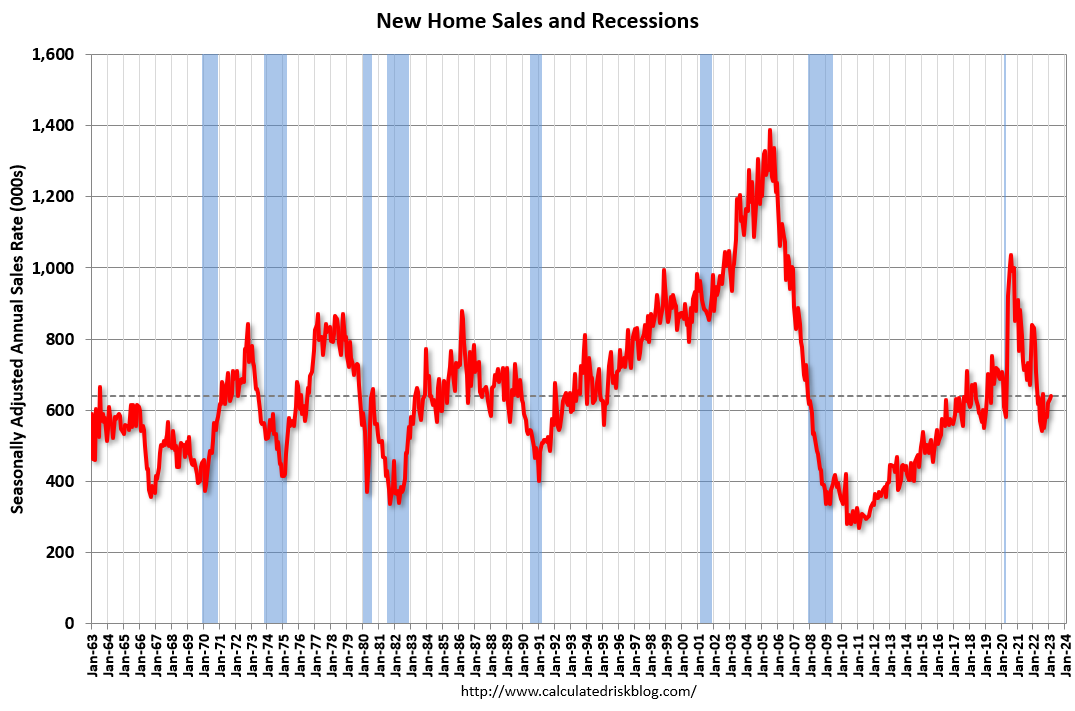
It is possible new home sales will be up year-over-year soon. This is mostly because new home sales declined sharply in early 2022, and also because new home sales are holding up better than existing home sales due to the lack of existing home inventory.
New home sales are counted when contracts are signed, whereas existing home sales are counted when transactions close. So reported new home sales tend to lead existing home sales by a few months, and existing home sales won’t be up year-over-year until later this year.
Mortgage Delinquency Rate Declined in Q1
As I’ve mentioned numerous times, there will not be a flood of distressed sales in this cycle that would lead to cascading price declines like following the housing bubble.
Here is some data from the MBA this morning: Mortgage Delinquency Rate in First-Quarter 2023 Declines to Second-Lowest Level in MBA’s Survey
The delinquency rate for mortgage loans on one-to-four-unit residential properties decreased to a seasonally adjusted rate of 3.56 percent of all loans outstanding at the end of the first quarter of 2023, according to the Mortgage Bankers Association’s (MBA) National Delinquency Survey.
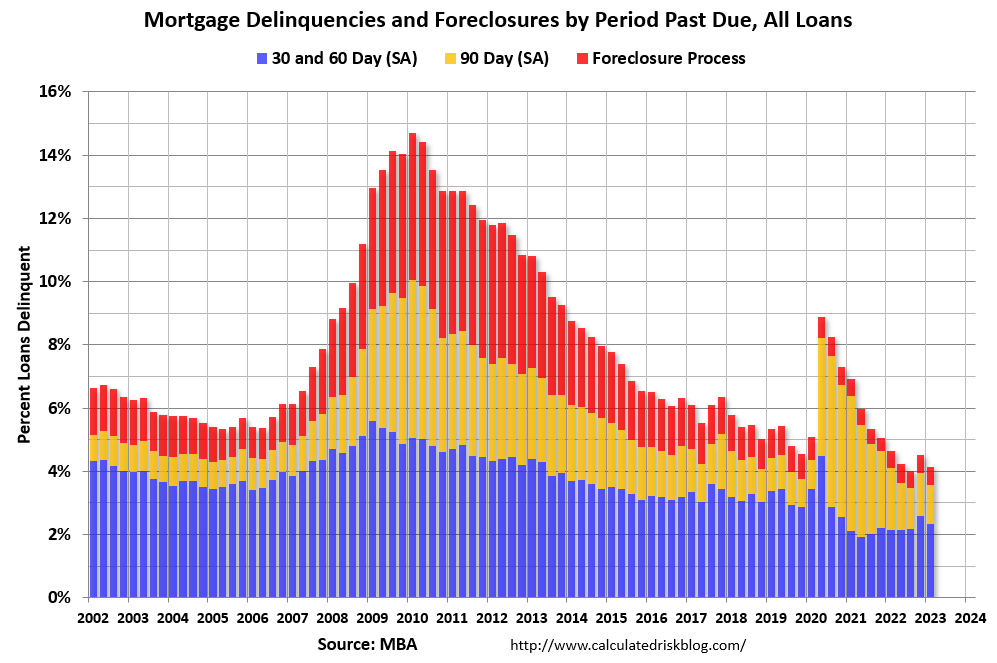
This graph shows the percent of loans delinquent by days past due. All categories of delinquency declined in Q1. The sharp increase in 2020 in the 90-day bucket was due to loans in forbearance (included as delinquent, but not reported to the credit bureaus).
In Part 2, I’ll discuss mortgage rates, house prices, rents and more.