CALCULATEDRISK
By Bill McBride
This 2-part overview for mid-August provides a snapshot of the current housing market.
The key stories this year for existing homes are that inventory increased sharply, and sales are down slightly compared to last year (and sales in 2024 were the lowest since 1995). That means prices are under pressure (although there will not be a huge wave of distressed sales).
And it has been a disappointing year for new homebuilders (but not as horrible as the housing bust!). Homebuilders have a growing number of completed homes for sales, a larger than normal number of unsold homes under construction and are reducing prices to compete with more existing home inventory.
Active Listings for Existing Homes Up Sharply Year-over-year
Realtor.com reports in the July 2025 Monthly Housing Market Trends Report that new listings were up 7.3% year-over-year in July. And active listings were up 24.8% year-over-year.
Homebuyers found more options in July, as the number of actively listed homes rose 24.8% compared with the same time last year. There are now over 1.1 million homes for sale nationwide, the third consecutive month with over 1 million active listings.
While July marks the 21st consecutive month of inventory gains, the pace of growth is beginning to slow. Active listings rose less than in prior months—down from 28.9% in June and 31.5% in May—suggesting the post-pandemic inventory recovery could be stalling a bit. Nationally, total active listings in July remained 13.4% below typical 2017–19 levels, a slightly wider gap than last month’s 12.9% shortfall. Overall, inventory growth seems to be slightly decelerating after taking off in early spring.

Note the seasonality for active listings. It now appears inventory will be close to 2019 levels by the end of 2025, and since sales are still depressed, months-of-supply will increase.
Here is some more data on supply and sales.
The following graph shows the seasonal pattern for active single-family inventory since 2015 through August 8, 2025, from Altos Research. The red line is for 2025. The black line is for 2019.

Inventory was up 24.0% compared to the same week in 2024, and down 10.1% compared to the same week in 2019. The previous week was the highest inventory level since November 2019.
Months-of-Supply
Since inventory has increased sharply and sales have been flat, a key for house prices is to watch months-of-supply. The following graph shows months-of-supply since 2017 using data from the NAR. Note that months-of-supply is higher than the previous 8 years!
Months-of-supply was at 4.7 months in June compared to 4.3 months in June 2019. National months-of-supply is now above pre-pandemic levels and will likely be above 5.0 months later this year (putting some pressure on prices). This is the highest level for months-of-supply since the summer of 2016.

Inventory would probably have to increase above 5+ months of supply to see national price declines.
In 2022, we saw some price declines at the National level even with fairly low months-of-supply – probably due to the sharp increase in inventory and some sellers panicking while remembering the housing bust!
There are significant regional differences in months-of-supply. Here is a table of the local markets I follow for June 2025.

Cities with more than 5+ months of supply this summer will likely see price declines. There is nothing magical about 6 months; some areas see price declines with less inventory, some more.
Over 5 Months of New Home Unsold Inventory Under Construction
For new homes, there are over 5 months of homes are under construction (see blue line below), well above the normal levels.
There are 2.3 months of completed supply (red line). This is above the normal level.
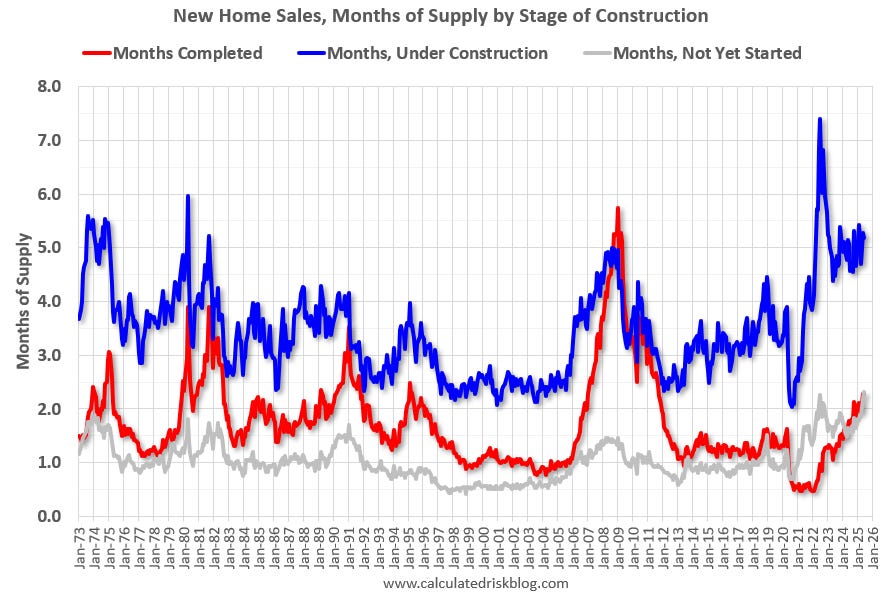
The inventory of new homes under construction is at 5.2 months (blue line). This has declined from 7.4 months in July 2022 but is still a much larger than normal number of homes under construction.
And 2.3 months of potential inventory that have not been started (grey line) – above the normal level. Homebuilders are probably waiting to start some homes until they clear more inventory, and have a firmer grasp on prices, mortgage rates and demand.
New home inventory, as a percentage of total inventory, is still very high. The following graph uses Not Seasonally Adjusted (NSA) existing home inventory from the National Association of Realtors® (NAR) and new home inventory from the Census Bureau (only completed and under construction inventory).

It took a number of years following the housing bust for new home inventory to return to the pre-bubble percent of total inventory. Then, with the pandemic, existing home inventory collapsed and now the percent of new homes is 20.3% of the total for sale inventory, down from 22.5% a year ago in June 2024, and down from a peak of 27.2% in December 2022.
The percent of new homes of total inventory should continue to decline as existing home inventory increases (with seasonal swings).
And for housing starts there are still an above normal number of multi-family housing units under construction, and 1.361 million total units under construction.
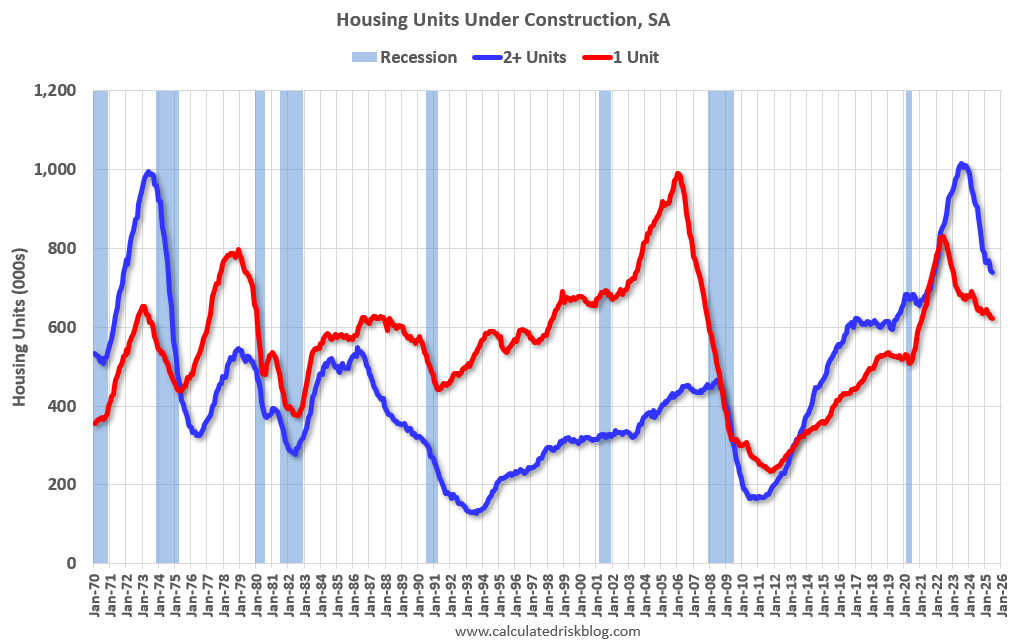
Currently there are 622 thousand single family units (red) under construction (SA). This was down in June compared to May, and 208 thousand below the pandemic peak in June 2022. And there are 739 thousand multi-family units (blue) under construction. This was down from 743 thousand in May. This is 277 thousand below the record set in July 2023 of 1,016 thousand.
Combined, there are 1.361 million units under construction, 354 thousand below the all-time record of 1.715 million set in October 2022.
In the three years prior to the pandemic, there were about 1.1 to 1.2 million housing units under construction – so the current level is still historically high.
Sales
The NAR reported sales were at a “seasonally adjusted annual rate of 3.93 million in June”.
As expected, existing home sales were essentially unchanged year-over-year in June. Sales have been mostly flat at close to 4 million SAAR for the last 2 1/2 years. This is running at the lowest level since 1995 on an annual basis.
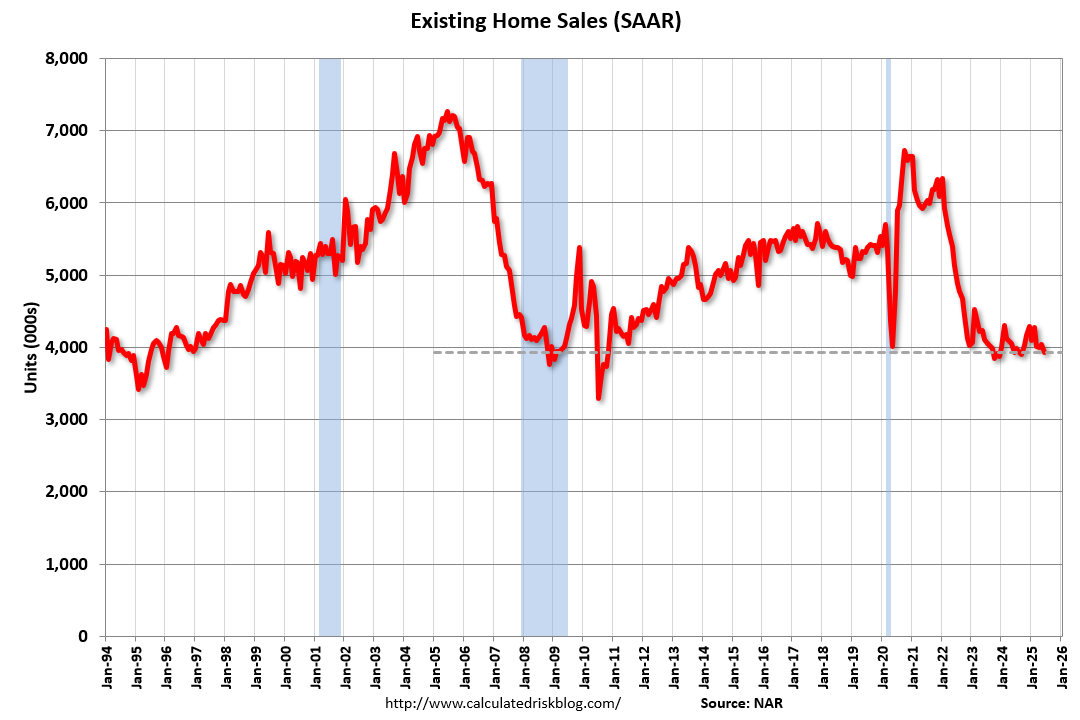
This was the 5th consecutive month with existing home sales unchanged or down year-over-year.
And for new home sales, the Census Bureau reported “Sales of new single-family houses in June 2025 were at a seasonally-adjusted annual rate of 627,000”, down 6.6% YoY from June 2024.
New home sales have bounced around mostly between 600 and 700 thousand for the last three years. This is well above the housing bust years.
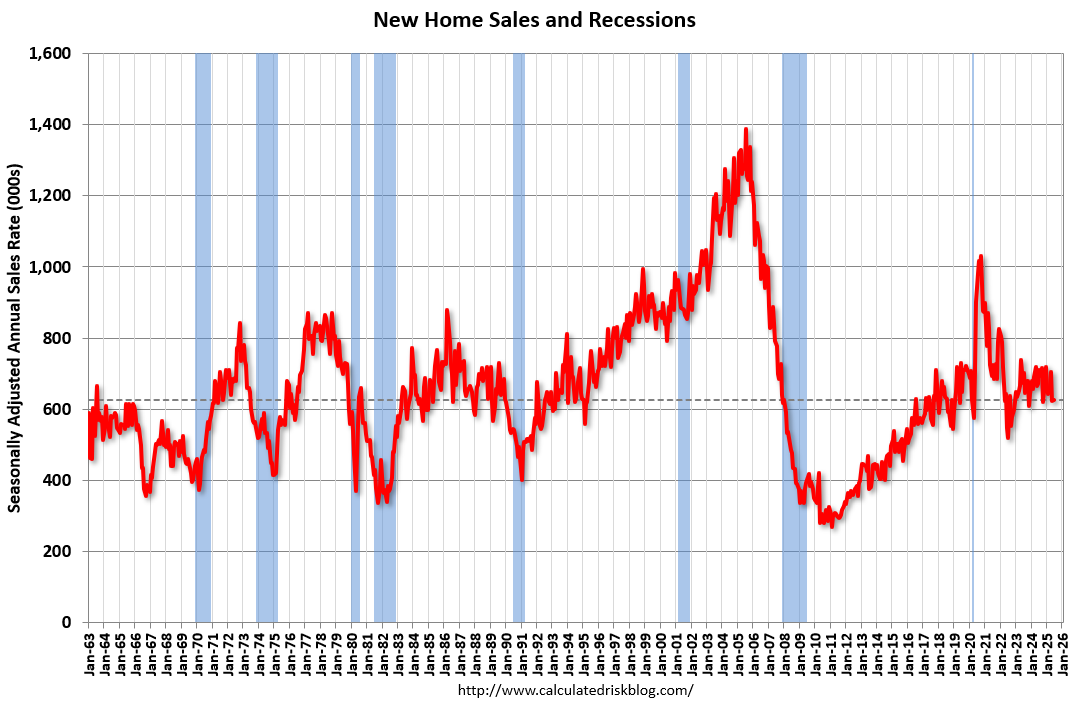
New home sales are below pre-pandemic levels.
Whenever I talk about housing, the first question is always “What will happen with house prices?” And I always start my answer discussing inventory.
Inventory will tell the tale.
In Part 2, I’ll review house prices, rents, mortgage rates, and more.