CALCULATEDRISK
By Bill McBride
This 2-part overview for mid-December provides a snapshot of the current housing market.
Note that we are still missing some key pieces of data due to the government shutdown, such as housing starts and new home sales.
The key stories this year for existing homes are that inventory increased sharply (almost back to pre-pandemic levels), and sales are depressed and tracking last year (sales in 2024 were the lowest since 1995). That means prices are under pressure, although there will not be a huge wave of distressed sales since most homeowners have substantial equity and low mortgage rates. It now appears likely that existing home prices will be mostly unchanged year-over-year nationally by the end of 2025.
It has also been a disappointing year for new homebuilders (but not as horrible as the housing bust!). Homebuilders have a growing number of completed homes for sales, a larger than normal number of unsold homes under construction and are reducing prices to compete with more existing home inventory.
Active Listings for Existing Homes Up Year-over-year
Realtor.com reports in the November 2025 Monthly Housing Market Trends Report that new listings were up 1.7% year-over-year in November. And active listings were up 12.6% year-over-year.
Homebuyers found more options in November, as the number of actively listed homes rose 12.6% compared to the same time last year. While this marks the 25th consecutive month of year-on-year inventory gains, active listing growth has slowed in each of the past six months (down from ~30% peak YoY growth in May and June). The number of homes for sale topped 1 million for the seventh consecutive month and remains close to midsummer levels. Still, nationwide November inventory is 11.7% below typical 2017–19 levels.
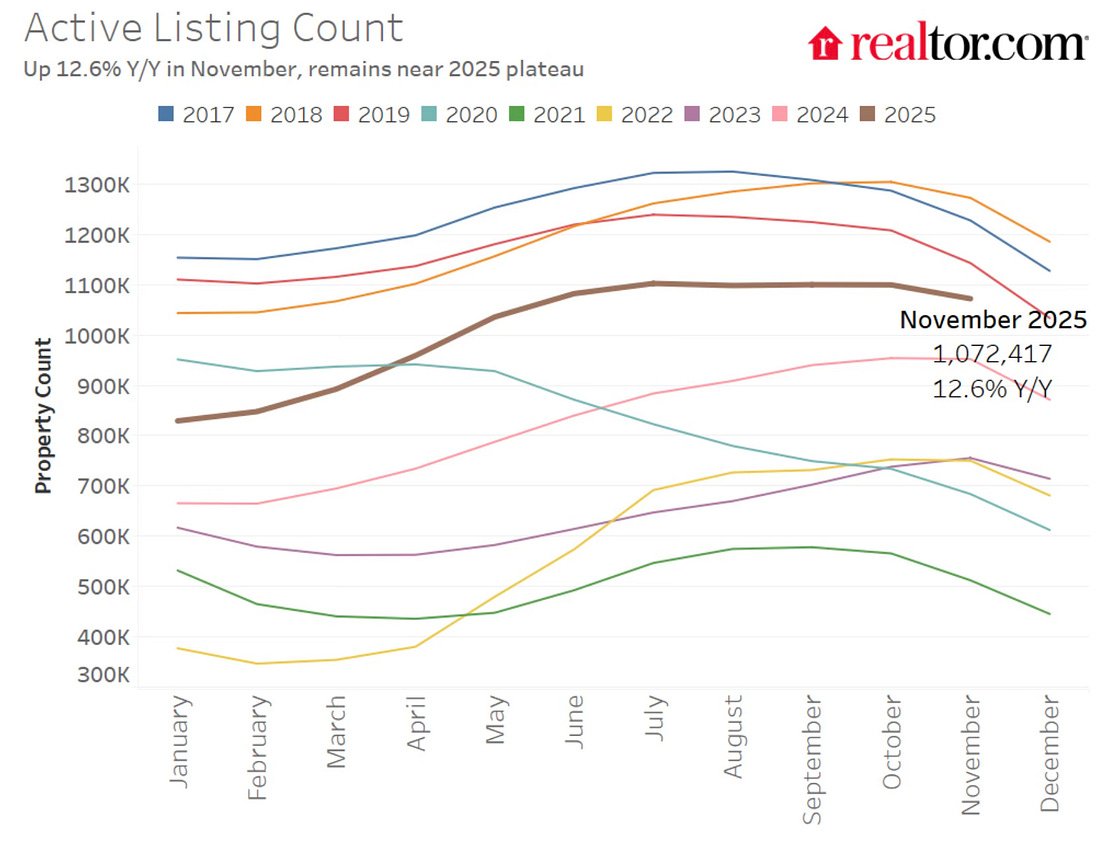
Note the seasonality for active listings. It appears inventory will still be below 2019 levels at the end of 2025.
Here is some more data on supply and sales.
The following graph shows the seasonal pattern for active single-family inventory since 2015 through December 12, 2025, from Altos Research. The red line is for 2025. The black line is for 2019.
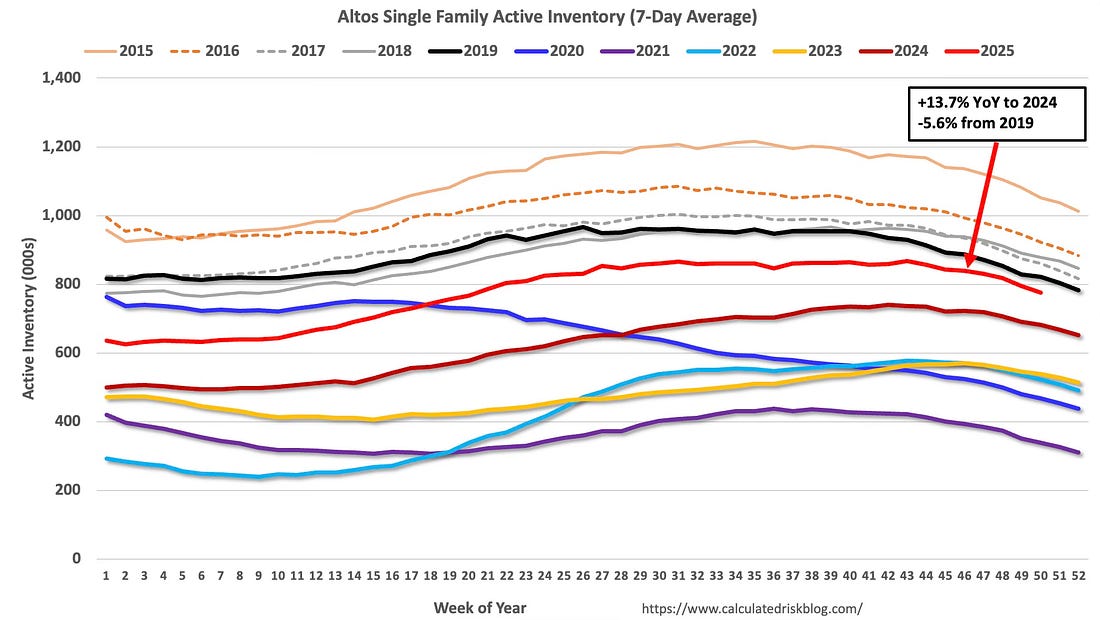
Inventory was up 13.7% compared to the same week in 2024, and down 5.6% compared to the same week in 2019. Inventory is close to pre pandemic levels, but will still be below 2019 levels at the end of 2025.
Months-of-Supply
Since inventory has increased and sales have been flat year-over-year, a key for house prices is to watch months-of-supply. The following graph shows months-of-supply since 2017 using data from the NAR. Note that months-of-supply is higher than the previous 8 years!
Months-of-supply was at 4.4 months in October compared to 3.9 months in October 2019. National months-of-supply is now above pre-pandemic levels.
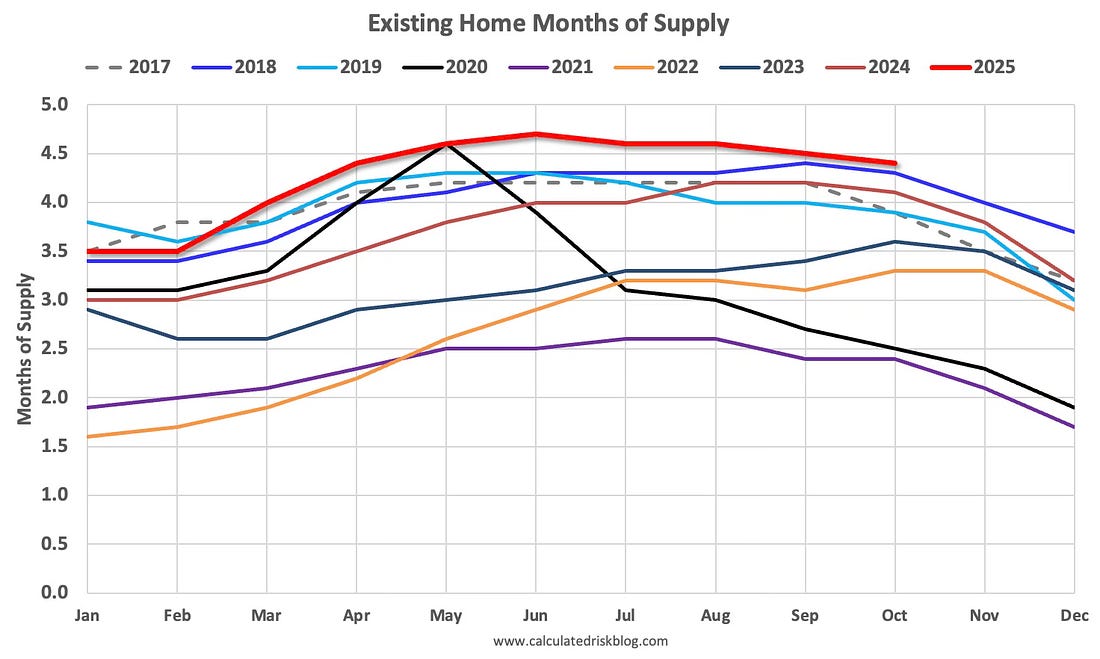
In 2022, we saw some price declines at the National level even with fairly low months-of-supply – probably due to the sharp increase in inventory and some sellers panicking while remembering the housing bust!
There are significant regional differences in months-of-supply. Here is a look at October months-of-supply using NSA sales.

Most cities with more than 5+ months of supply are seeing price declines. There is nothing magical about 6 months; some areas see price declines with less inventory, some more.
Sales
The NAR reported sales were at a “seasonally adjusted annual rate of 4.10 million in October”.
Sales in October were up 1.2% from the previous month and were up 1.7% compared to the October 2024 sales rate.
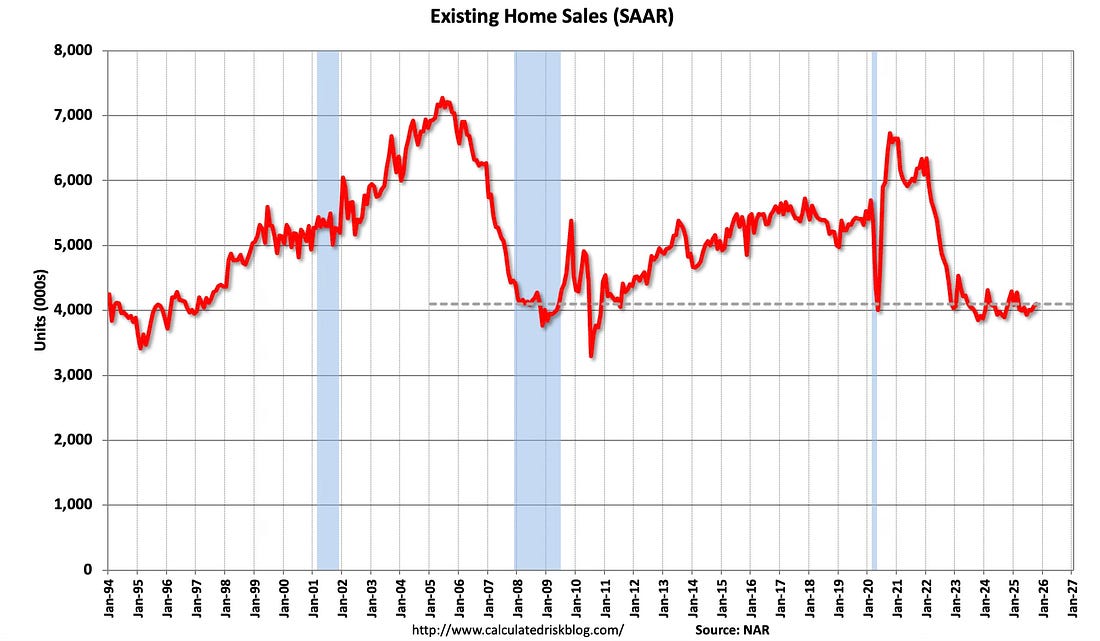
Sales have bounced around a 4 million annual sales rate for the last 3 years.Year-to-date, sales are unchanged NSA compared to the same period in 2024.
And for new home sales, the Census Bureau will release the data soon (with the end of the government shutdown).
Whenever I talk about housing, the first question is always “What will happen with house prices?” And I always start my answer discussing inventory.
Inventory will tell the tale.
In Part 2, I’ll review house prices, rents, mortgage rates, and more.