CALCULATEDRISK
By Bill McBride
This 2-part overview for mid-February provides a snapshot of the current housing market.
I always focus first on inventory, sinceinventory usually tells the tale! I’m watching months-of-supply closely.
New Listings for Existing Homes Up Year-over-year in January
Here is a graph of new listing from Realtor.com’s January 2025 Monthly Housing Market Trends Report showing new listings were up 10.8% year-over-year in January. New listings are still well below pre-pandemic levels.From Realtor.com:
On the bright side, sellers increased their activity this January as newly listed homes were 10.8% above last year’s levels, an increase from December’s small rise of 0.9%. This puts new listing activity at its highest January level since 2021. While rates remain elevated, it is possible that we might be seeing that chiseling effect starting as sellers may grow tired of waiting for significant changes in rates. Further, while the lock-in effect remains a factor for many sellers, the strength of the effect is gradually waning.
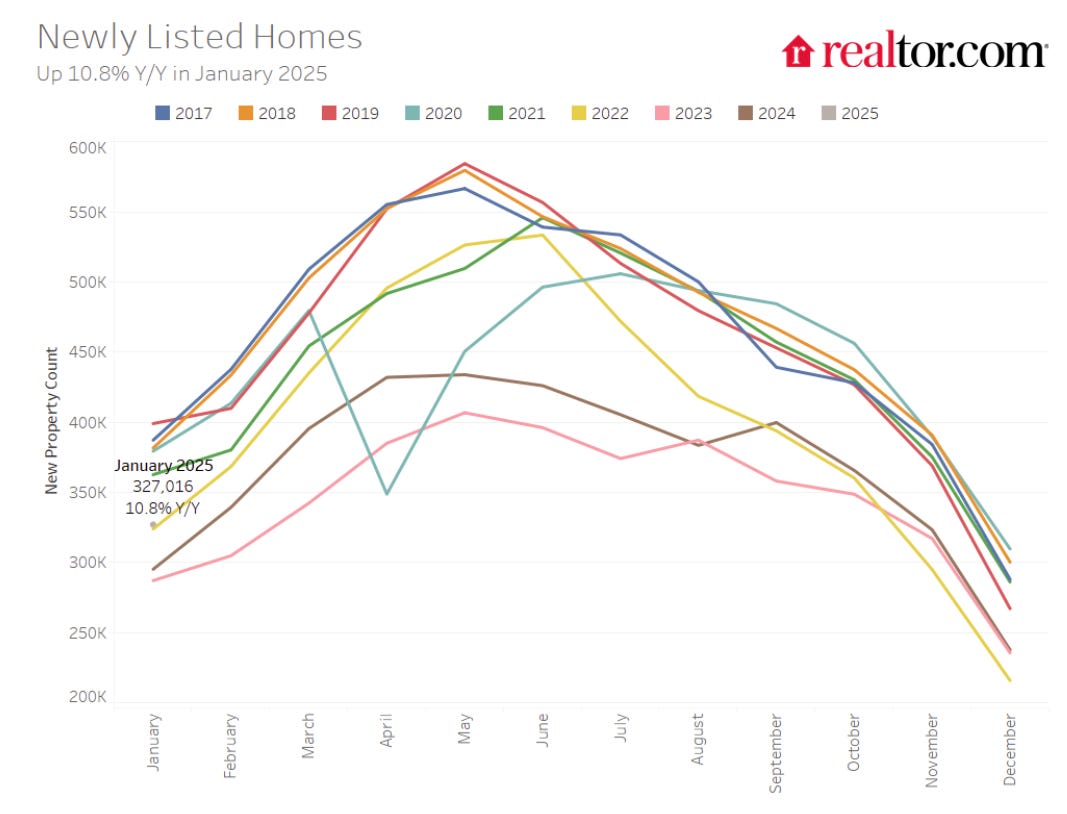
Note the seasonality for new listings. December and January are seasonally the weakest months of the year for new listings, followed by February and November.
The key will be what happens in March!
Impact on Active Inventory
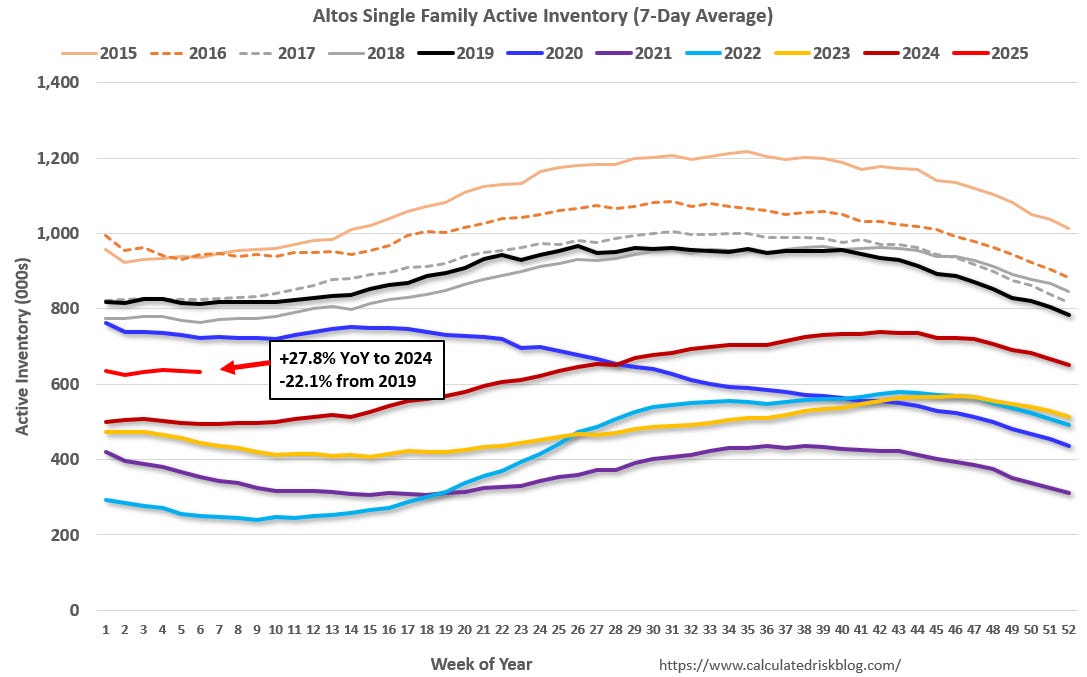
The following graph shows the seasonal pattern for active single-family inventory since 2015 through February 7, 2025, from Altos Research. The red line is for 2025. The black line is for 2019.
Inventory was up 27.8% compared to the same week in 2024 (last week it was up 277%), and down 22.1% compared to the same week in 2019 (last week it was down 22.2%).
The gap to more normal inventory levels is closing, but there is still a way to go to get back to 2019 levels nationally.
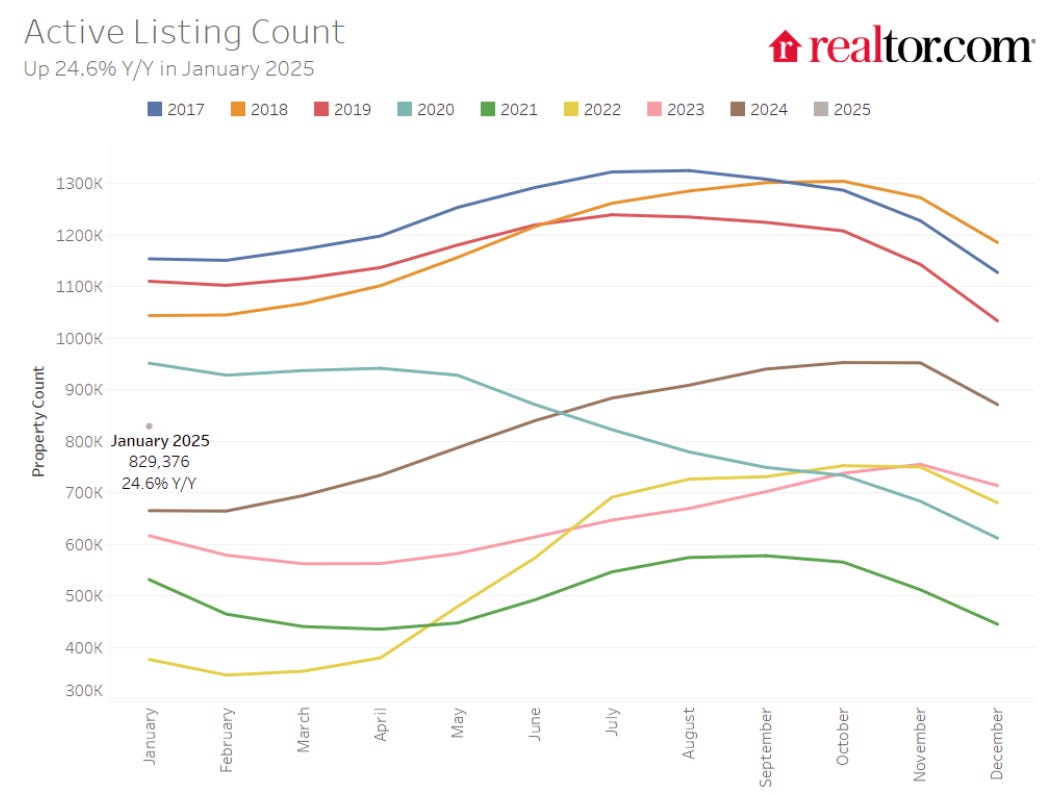
And here is a monthly graph of active inventory from Realtor.com. In January, active inventory was up 24.6% year-over-year.
Since both inventory and sales have fallen significant, a key for house prices is to watch months-of-supply. The following graph shows months-of-supply since 2017. Note that months-of-supply is higher than the last 5 years (2019 – 2023) and 2017, and close to 2018 levels. In 2020 (black), months-of-supply increased at the beginning of the pandemic and then declined sharply.
Months-of-supply was at 3.3 months in December compared to 3.0 months in December 2019. Months-of-supply was at 3.7 in December 2018. Note that December and January usually have the lowest months-of-supply.
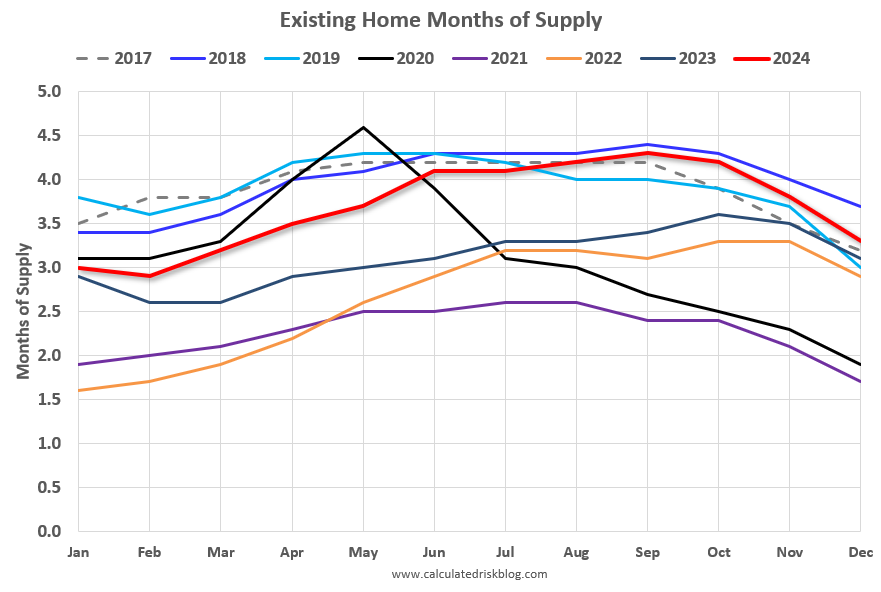
This suggests that year-over-year price growth will continue to slow. Inventory would probably have to increase to 5 1/2 to 6 months of supply to see national price declines again.
In 2022, we saw some price declines at the National level even with fairly low months-of-supply – probably due to the sharp increase in inventory and some sellers panicking while remembering the housing bust!
There are significant regional differences in months-of-supply. Here is a table of the local markets I follow for December 2024:
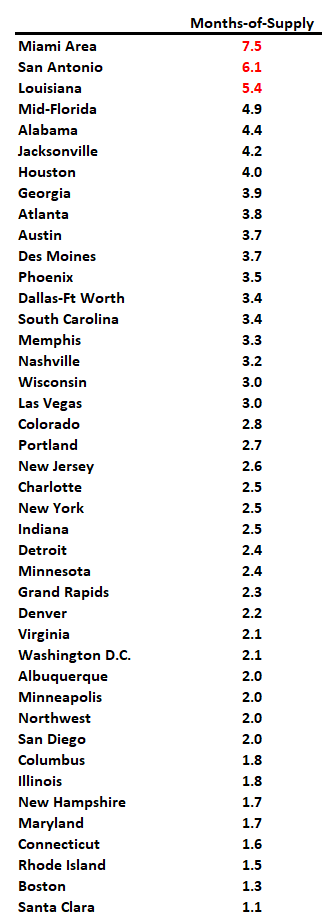
Areas with months-of-supply above 6 will see price pressures. All of the areas with months-of-supply at 4+ months in December will likely be pushing or exceeding 6 months during the summer months.
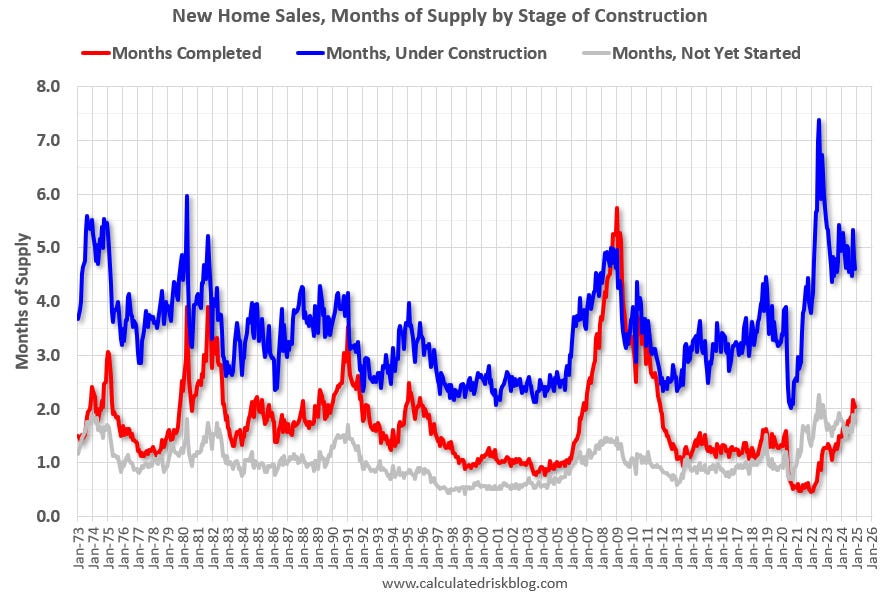
Almost 5 Months of New Home Unsold Inventory Under Construction; 2 Months Completed Supply
For new homes, there are 4.6 months of homes are under construction (blue line below) – generally declining, but still well above the normal level. There are 2.0 months of completed supply (red line). This is above the normal level.
New home inventory, as a percentage of total inventory, is still very high. The following graph uses Not Seasonally Adjusted (NSA) existing home inventory from the National Association of Realtors® (NAR) and new home inventory from the Census Bureau (only completed and under construction inventory).
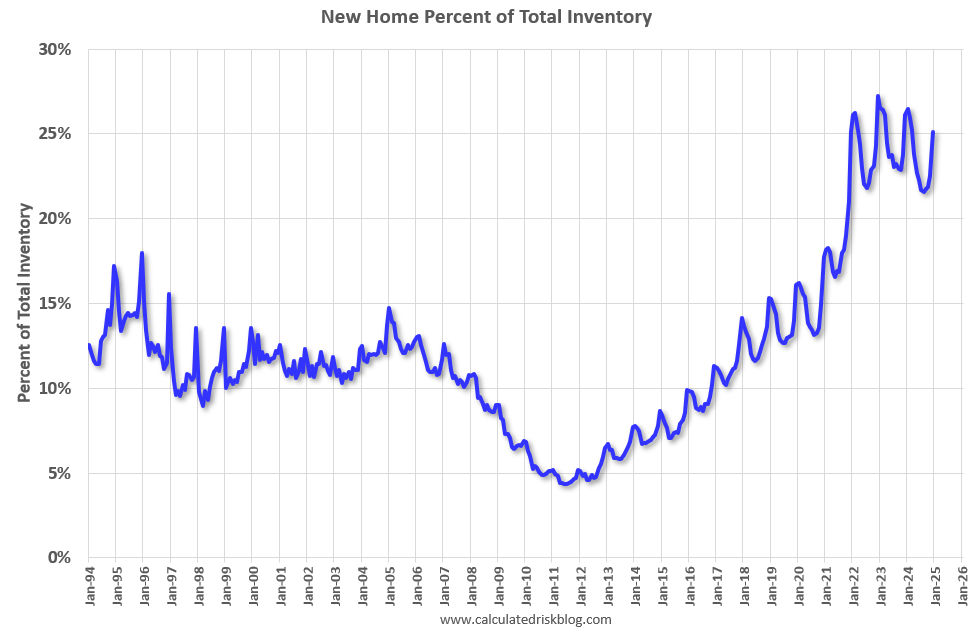
It took a number of years following the housing bust for new home inventory to return to the pre-bubble percent of total inventory. Then, with the pandemic, existing home inventory collapsed and now the percent of new homes is 25.1% of the total for sale inventory, down from a peak of 27.2% in December 2022.
The percent of new homes of total inventory should continue to decline as existing home inventory increases.However, the percent of new home inventory has increased seasonally over the Winter as existing homes are withdrawn from the market.
And for housing starts there are still a large number of multi-family housing units under construction, and 1.431 million total units under construction. However, multi-family housing units under construction is now declining rapidly.
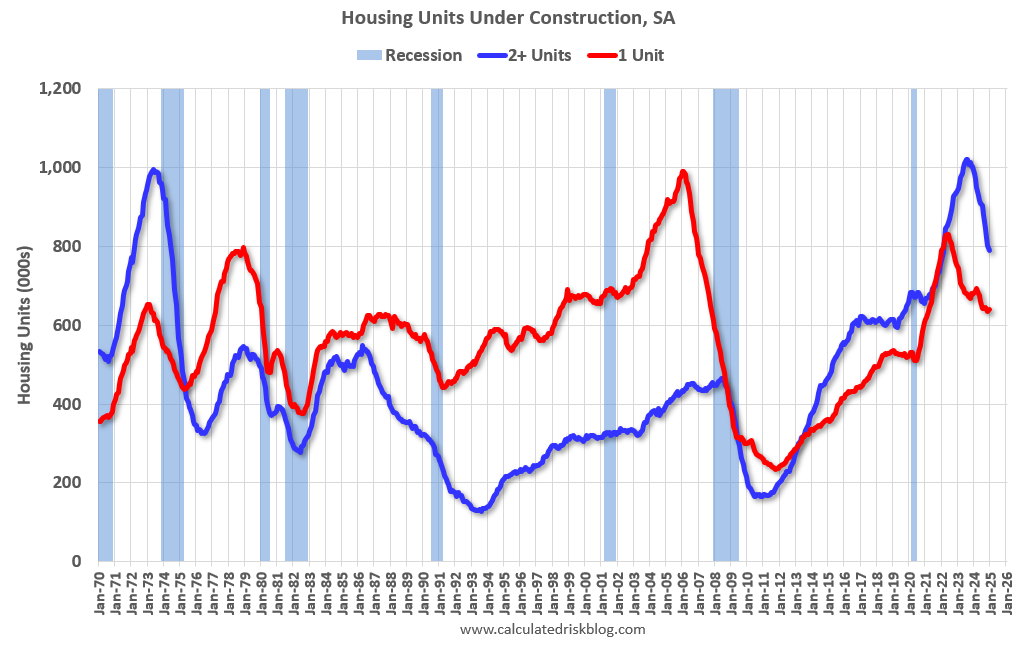
Currently there are 641 thousand single family units (red) under construction (SA). This was up slightly in December compared to November, and 189 thousand below the pandemic peak in May 2022. Currently there are 790 thousand multi-family units (blue) under construction. This is 231 thousand below the record set in July 2023 of 1,021 thousand.
Combined, there are 1.431 million units under construction, 280 thousand below the all-time record of 1.711 million set in October 2022 and the fewest since August 2021.
For comparison, in the three years prior to the pandemic, there were about 1.1 to 1.2 million housing units under construction – so the current level is still historically high.
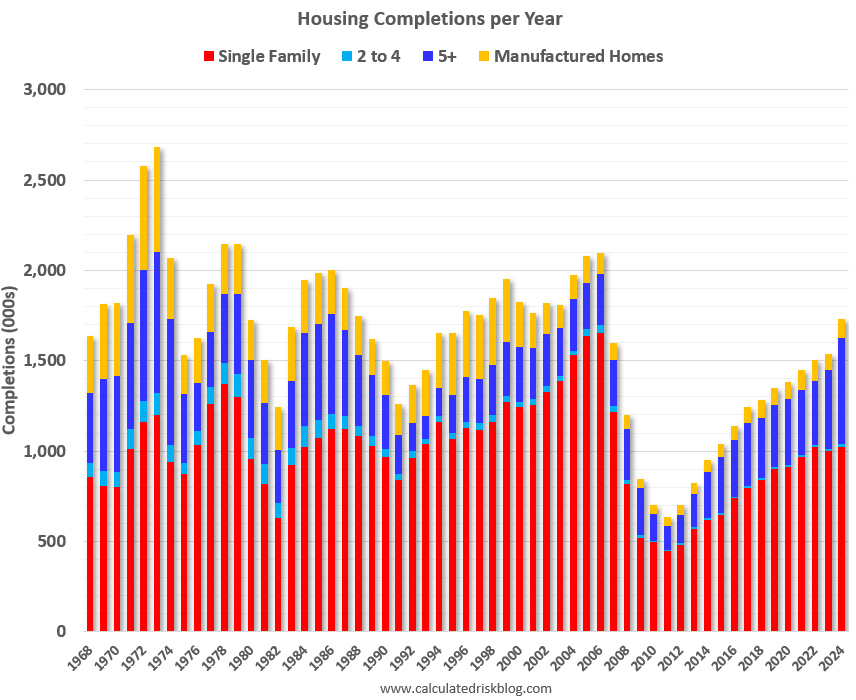
There were 1.73 million total housing completions in 2024 including manufactured homes, the most Since 2006. There will still be an above normal level of completions in 2025, before returning to more normal levels in 2026.
Sales
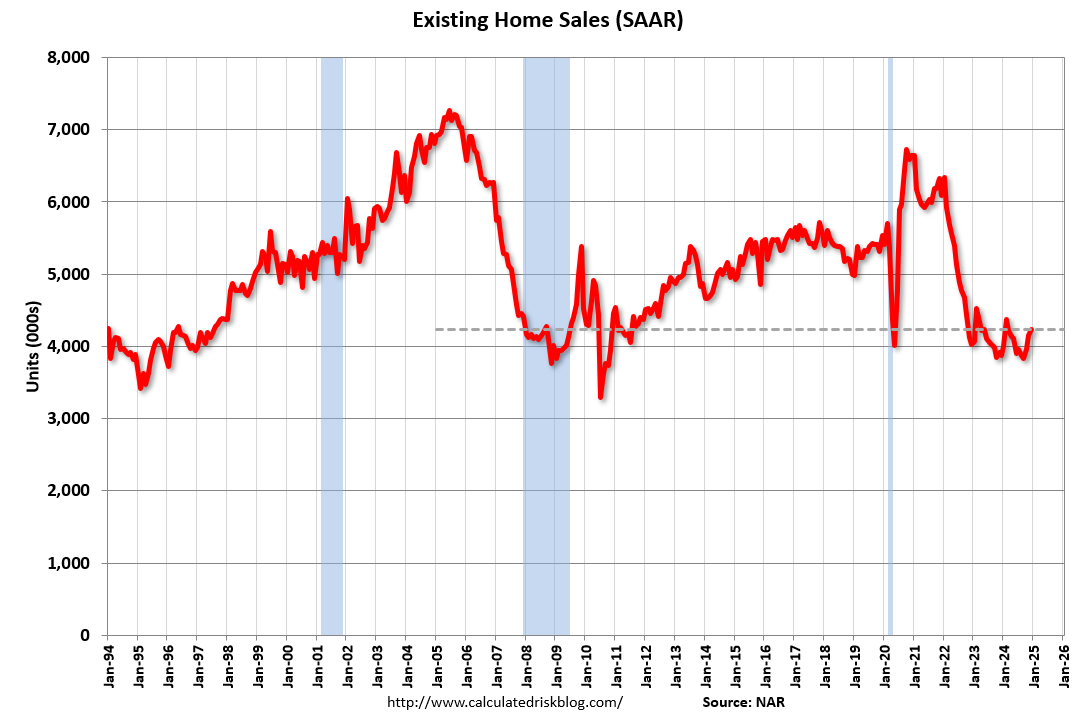
The NAR reported sales were at a “seasonally adjusted annual rate of 4.24 million in December” As expected, existing home sales were up year-over-year for the third consecutive month, after being down year-over-year every month since 2021. This was a combination of weak sales in December 2023 and lower mortgage rates in October and November when contracts were signed (Existing home sales are reported at closing).
And for new home sales, the Census Bureau reported “Sales of new single-family houses in December 2024 were at a seasonally adjusted annual rate of 698,000”, up 6.7% YoY from December 2023.
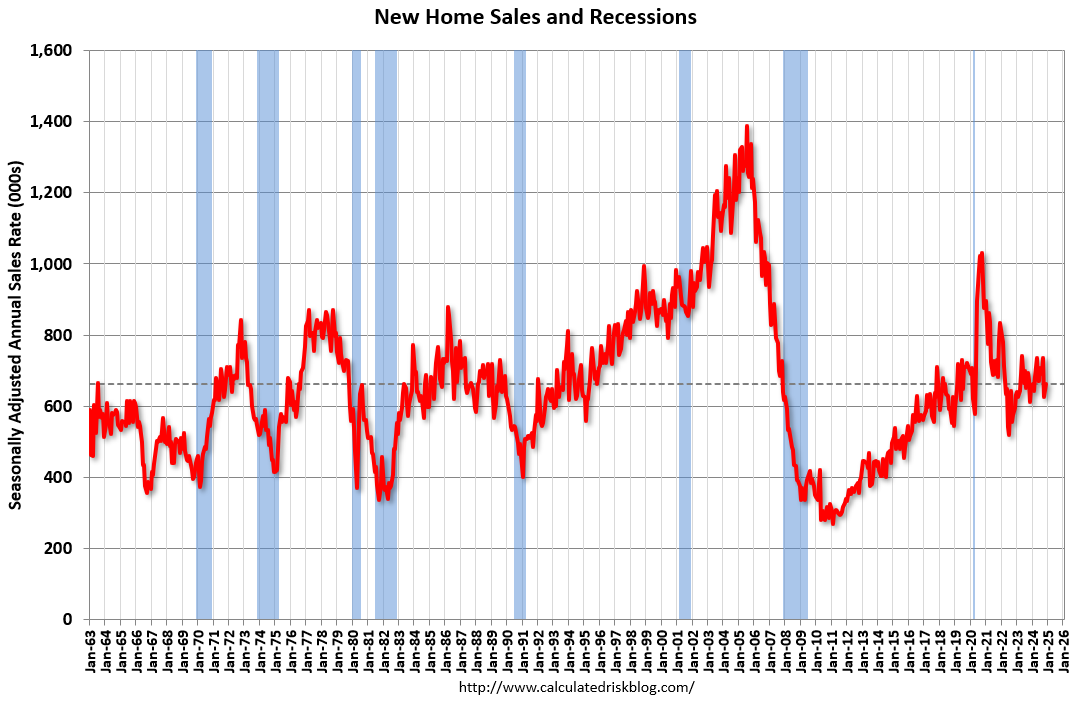
New home sales bottomed in July 2022 and new home sales have held up better than existing home sales due to the lack of existing home inventory and the lack of distressed sales this cycle – and new home builders are using various tools to attract buyers such as mortgage rate buydowns.
A key for house prices will be to watch existing home months-of-supply!
In Part 2, I’ll review house prices, rents, mortgage rates, and more.