Part 1: Current State of the Housing Market; Overview for mid-January 2024
CALCULATEDRISK
By Bill McBride
This 2-part overview for mid-January provides a snapshot of the current housing market. This includes sales, house prices, inventory, mortgage rates, rents and more.
I always like to start with inventory, since inventory usually tells the tale!
New Listings for Existing Homes Up Year-over-year in December
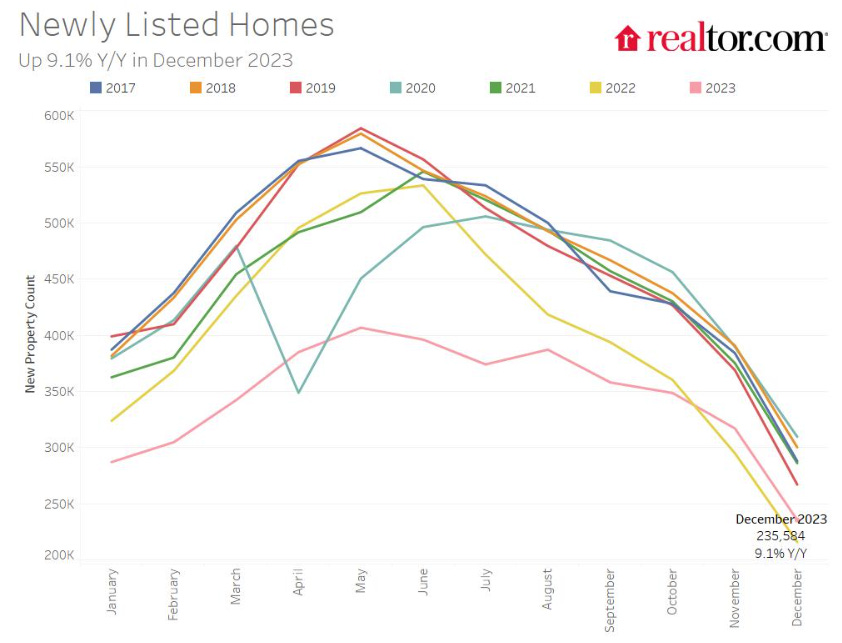
Here is a graph of new listing from Realtor.com’s December 2023 Monthly Housing Market Trends Report showing new listings were up 9.1% year-over-year in December. New listings finished 2023 up year-over-year mostly because new listings collapsed in the 2nd half of 2022. From Realtor.com:
Providing a boost to overall inventory, sellers turned out in higher numbers this December as newly listed homes were 9.1% above last year’s levels. This marked the second month of increasing listing activity after a 17-month streak of decline.
Note the seasonality for new listings. December and January are seasonally the weakest months of the year for new listings. It seems very likely that new listings will be up year-over-year in 2024, but we will have to wait for the March data to see how close new listings are to normal levels.
Impact on Active Inventory
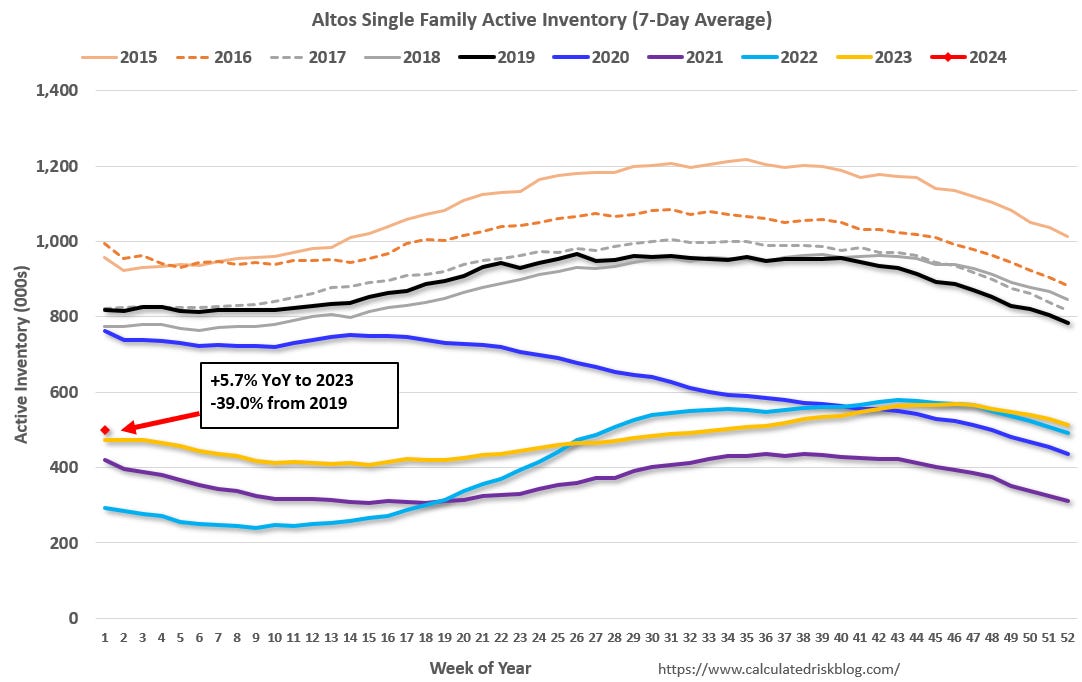
The following graph shows the seasonal pattern for active single-family inventory since 2015 through early 2024 from Altos Research. The red dot is for 2024. The black line is for 2019.
Inventory was up 5.7% compared to the same week in 2023 (last week it was up 4.4% YoY), and down 39.0% compared to the same week in 2019 (last week down 34.4%).
Back in June 2023, inventory was down almost 54% compared to 2019, so the gap to more normal inventory levels is closing, but existing home inventory is still historically very low.
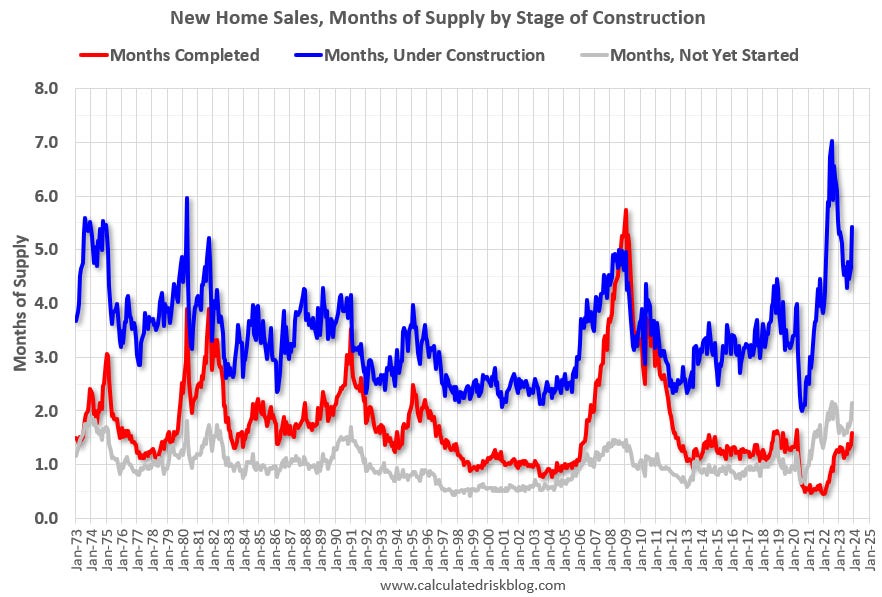
New Home Inventory Under Construction Remains Elevated
For new homes, there are 5 1/2 months of homes under construction (blue line below) – well above the normal level. There are 1.6 months of completed supply (red line). This is close to the normal level.
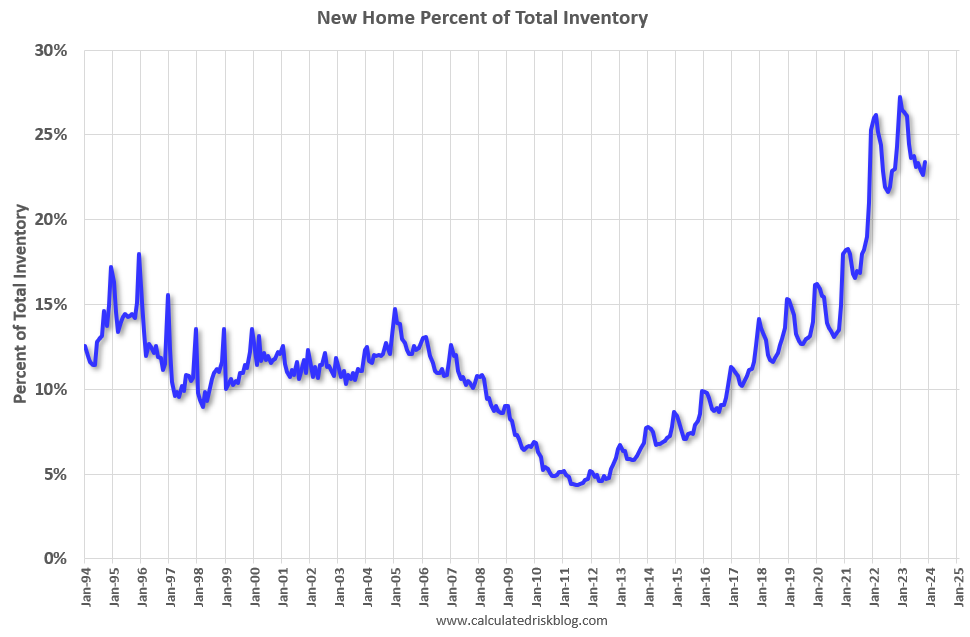
New home inventory is close to a record percentage of total inventory but is now declining as a percent of total for sale inventory.
This graph uses Not Seasonally Adjusted (NSA) existing home inventory from the National Association of Realtors® (NAR) and new home inventory from the Census Bureau (only completed and under construction inventory).
Note: Mark Fleming, Chief Economist at First American pointed this out in March.
It took a number of years following the housing bust for new home inventory to return to the pre-bubble percent of total inventory. Then, with the pandemic, existing home inventory collapsed and now the percent of new homes is 23.4% of the total for sale inventory. The lack of existing home inventory, and few distressed sales, has been a positive for homebuilders.
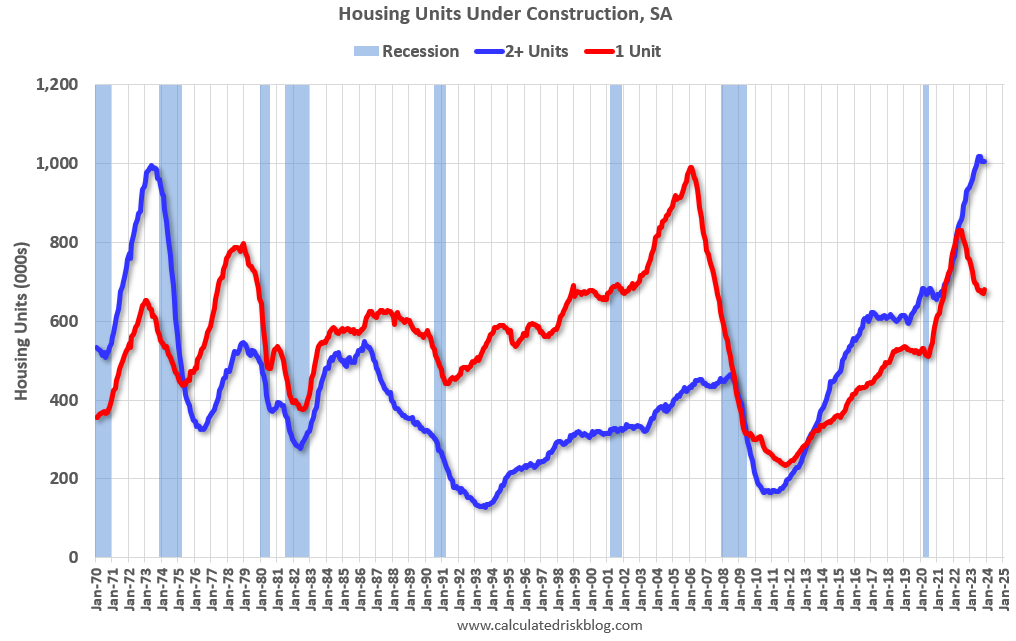
And for housing starts there are a nearrecord number of multi-family housing units under construction, and a near record 1.685 million total units under construction.
Red is single family units. Currently there are 680 thousand single family units (red) under construction (SA). This was up in November compared to October, and 151 thousand below the recent peak in May 2022. Blue is for 2+ units. Currently there are 1,005 thousand multi-family units under construction. This is slightly below the record set in July 2023 of 1,018 thousand.
Combined, there are 1.685 million units under construction, just 25 thousand below the all-time record of 1.710 million set a year ago in October 2022.
Sales
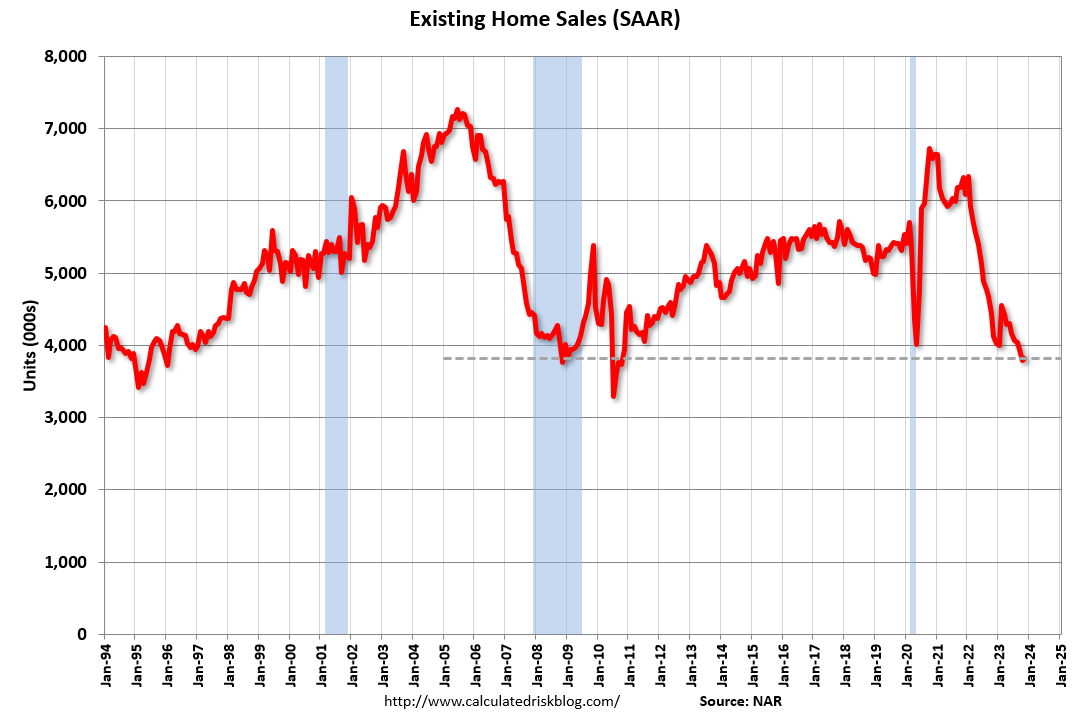
The NAR reported sales were at a “seasonally adjusted annual rate of 3.82 million in November. Year-over-year, sales fell 7.3% (down from 4.12 million in November 2022).” This was close to the local markets I tracked for November.
This was 0.8% above the cycle low set the previous month. Early local market data suggests sales will be up month-over-month in December, and down slightly year-over-year.
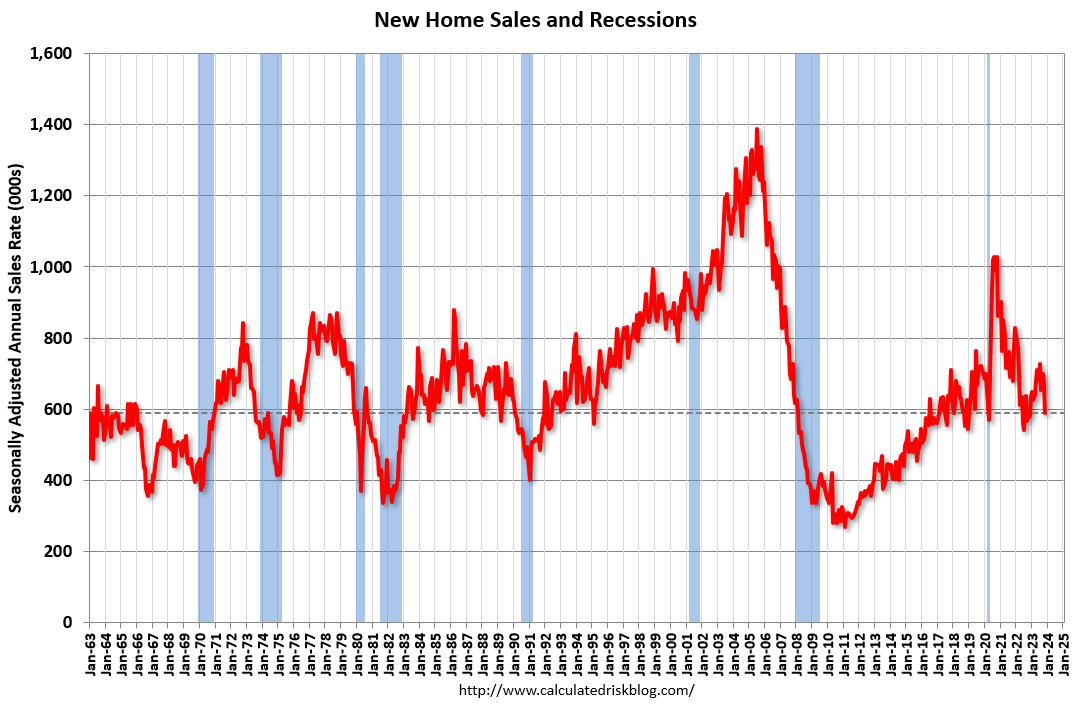
And the Census Bureau reported “Sales of new single‐family houses in November 2023 were at a seasonally adjusted annual rate of 590,000”, up 1.4% YoY from November 2022.
New home sales bottomed in July 2022. Despite the weakness in November, new home sales are holding up better than existing home sales due to the lack of existing home inventory and the lack of distressed sales this cycle – and new home builders are using various tools to attract buyers such as 3-2-1 mortgage rate buydowns.
Yesterday Rick Palacios Jr at JBREC noted on Threads:
“Falling mortgage rates clearly boosted December new home sales, with home builders reporting a nice uptick in sales per community, defying the usual Nov to Dec seasonal drop. This unseasonal MOM rise happened only two other times in our survey’s 14-year history.”
In Part 2, I’ll discuss mortgage rates, house prices, rents and more.