Part 1: Current State of the Housing Market; Overview for mid-July
CALCULATEDRISK
By Bill McBride
In this 2-part overview of the housing market for mid-July, I’ll discuss new and existing home inventory and sales, house prices, mortgage rates, rents and more.
New Listings Near Pandemic Low for June
Here is a graph of new listing from Realtor.com’s June 2023 Monthly Housing Market Trends Report showing new listings were down about 26% year-over-year in June. The year-over-year decline was slightly larger in June than in May. From Realtor.com:
In June, the number of homes newly-listed for sale declined by 25.7% compared to the same time last year. This was a faster rate of decline than May’s 22.7% decrease and new listings remained 27.6% below pre-pandemic 2017 to 2019 levels. During the first half of 2023, there were 20.1% fewer newly listed homes for sales on a typical day compared to the first half of 2022. The difference was more pronounced when compared to the first-half in the pre-pandemic years (2017 to 2019). In fact, the pace of new home listings year to date is even 16.4% lower than in the first half of 2020 when the real estate market was still contending with pandemic-era closures, restrictions, and uncertainties, highlighting just how short-on-new-options buyers in today’s market really are.
For the local markets I track that have reported so far, are show new listings were down more in June than in May.
For these areas, new listings were down 26.4% YoY. … Last month, new listings in these markets were down 21.9% YoY.
Impact on Active Inventory
The following graph shows the seasonal pattern for active single-family inventory since 2015 from Altos Research. The red line is for 2023. The black line is for 2019.
Inventory was down 4.6% compared to the same week in 2022, and down 51.0% compared to the same week in 2019. Inventory bottomed seasonally in mid-April but hasn’t increased significantly since then.
It appears likely same week inventory will be below 2022 levels for the remainder of the year, but above 2021 levels – and possibly above 2020 levels late in the year.
For new homes, there are 4.1 months of homes under construction (blue line below) – well above the normal level, but declining. This elevated level of homes under construction is due to supply chain constraints. There are 1.1 months of completed supply (red line). This is slightly below the normal level.
Interestingly, new home inventory is close to a record percentage of total inventory. This graph uses Not Seasonally Adjusted (NSA) existing home inventory from the National Association of Realtors® (NAR) and new home inventory from the Census Bureau (only completed and under construction inventory).
Note: Mark Fleming, Chief Economist at First American pointed this out in March
It took a number of years following the housing bust for new home inventory to return to the pre-bubble percent of total inventory. Then, with the pandemic, existing home inventory collapsed and now the percent of new homes is close to 23% of total for sale inventory. The lack of existing home inventory, and few distressed sales, has been a positive for homebuilders.
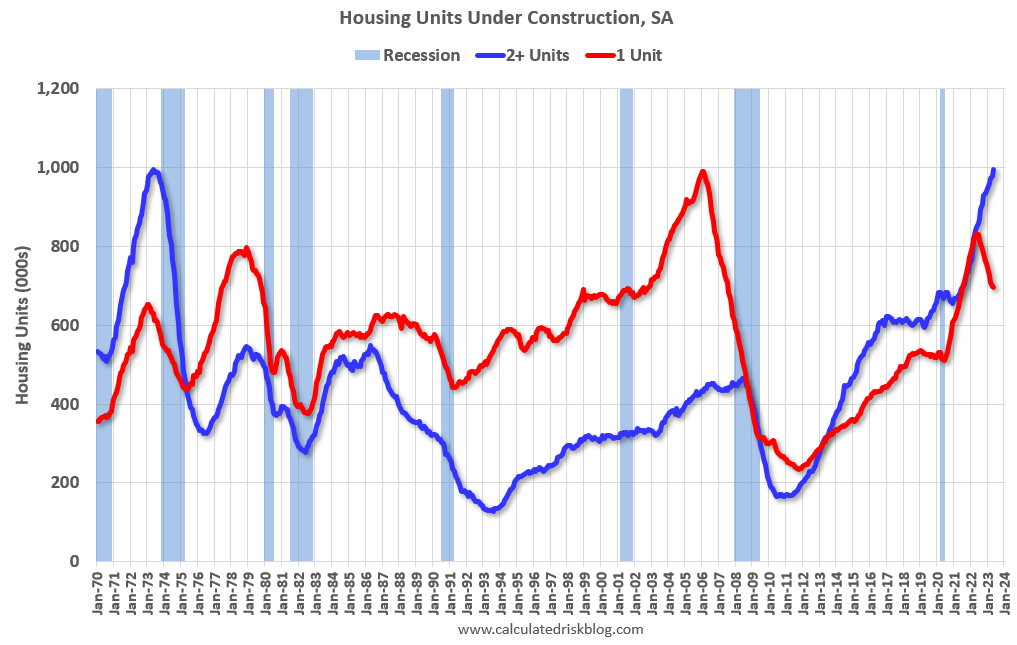
And for housing starts there are a near record 1.698 million units under construction.
Red is single family units. Currently there are 695 thousand single family units (red) under construction (SA). Blue is for 2+ units. Currently there are 994 thousand multi-family units under construction. This ties the record set in July 1973 of multi-family units being built for the baby-boom generation.
Combined, there are 1.689 million units under construction, just 21 thousand below the all-time record of 1.710 million set in October 2022.
Sales
We saw a decline in both new and existing home sales due to higher mortgage rates, but it appears sales have bottomed. The NAR reported sales were at a “seasonally adjusted annual rate of 4.30 million in May. Year-over-year, sales dropped 20.4% (down from 5.40 million in May 2022).” This was in line with the local markets I track for May.
The early local market reports suggest a smaller year-over-year decline in closed sales NSA in June. Since sales were declining all year in 2022, the YoY decline will shrink even is sales are flat.
It is possible that existing home sales, seasonally adjusted, bottomed in December and January. But a bottom in existing home sales doesn’t mean other measures are near a bottom. There are usually two bottoms for housing (see: Has Housing “Bottomed”?)
[T]here will be two bottoms for housing: one for activity and the other for prices. Existing home sales may have already bottomed, but we will see further declines in residential investment. Prices – especially in real terms – will be under pressure for some time.
And the Census Bureau reported “Sales of new single‐family houses in May 2023 were at a seasonally adjusted annual rate of 763,00”, up 12.2% YoY from May 2022.
New home sales have likely bottomed and appear to be increasing (unlike existing home sales that is mostly flat at a low level). This is mostly because new home sales are holding up better than existing home sales due to the lack of existing home inventory.
New home sales are counted when contracts are signed, whereas existing home sales are counted when transactions close. So reported new home sales tend to lead existing home sales by a few months, and existing home sales won’t be up year-over-year until later this year.
In Part 2, I’ll discuss mortgage rates, house prices, rents and more.