CALCULATEDRISK
By Bill McBride
This 2-part overview for mid-June provides a snapshot of the current housing market.
I always like to start with inventory, since inventory usually tells the tale! And currently inventory is increasing year-over-year but is still well below pre-pandemic levels.
New Listings for Existing Homes Up Year-over-year in May
Here is a graph of new listing from Realtor.com’s May 2024 Monthly Housing Market Trends Report showing new listings were up 6.2% year-over-year in May. New listings are still well below pre-pandemic levels.From Realtor.com:
However, sellers continued to list their homes in higher numbers this May as newly listed homes were 6.2% above last year’s levels. While a notable deceleration from last month’s 12.2% growth rate, it marks the seventh month of increasing listing activity after a 17-month streak of decline.
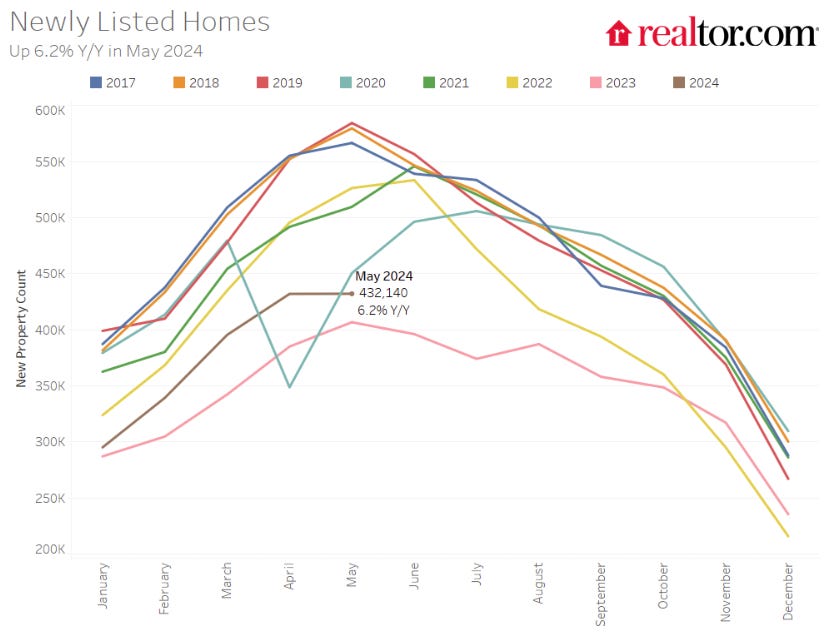
Note the seasonality for new listings. December and January are seasonally the weakest months of the year for new listings, followed by February and November. New listings will be up year-over-year in 2024, but still below normal levels.
There are always people that need to sell due to the so-called 3 D’s: Death, Divorce, and Disease. Also, in certain times, some homeowners will need to sell due to unemployment or excessive debt (neither is much of an issue right now).
And there are homeowners who want to sell for a number of reasons: upsizing (more babies), downsizing, moving for a new job, or moving to a nicer home or location (move-up buyers). It is some of the “want to sell” group that has been locked in with the golden handcuffs over the last couple of years, since it is financially difficult to move when your current mortgage rate is around 3%, and your new mortgage rate will be above 7%.
But time is a factor for this “want to sell” group, and eventually some of them will take the plunge. That is probably why we are seeing more new listings now.
Impact on Active Inventory
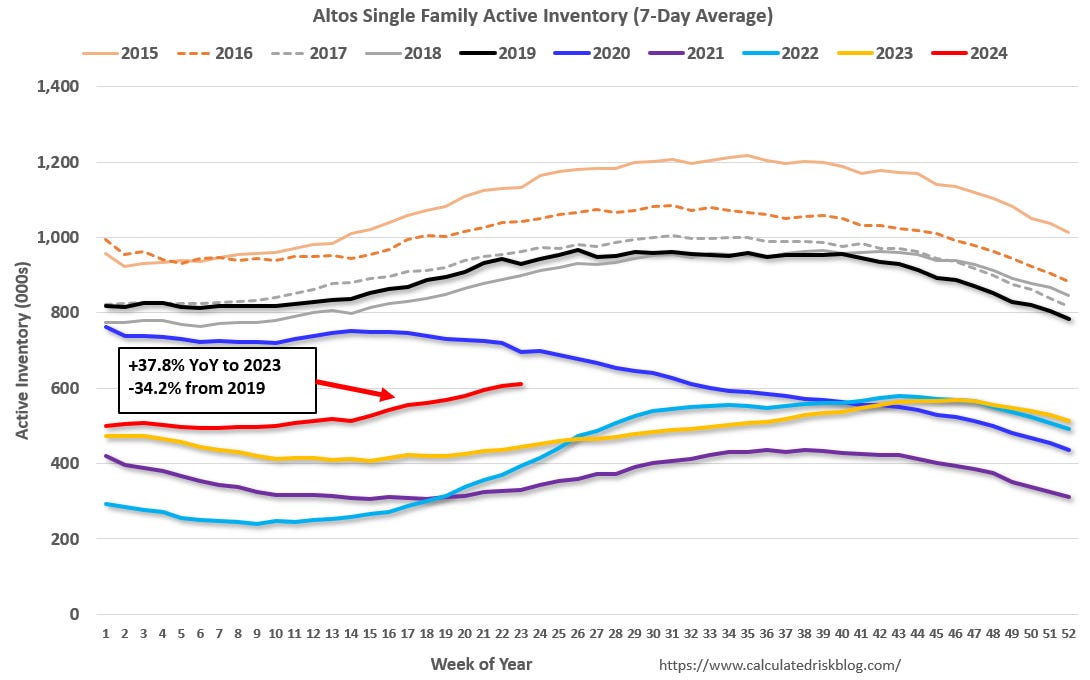
The following graph shows the seasonal pattern for active single-family inventory since 2015 through June 7, 2024, from Altos Research. The red line is for 2024. The black line is for 2019.
Note that inventory is up 86% from the record low for the same week in 2022, but still well below normal levels.
Inventory was up 37.8% compared to the same week in 2023 (last week it was up 38.4%), and down 34.2% compared to the same week in 2019 (last week it was down 35.7%).
Back in June 2023, inventory was down almost 54% compared to 2019, so the gap to more normal inventory levels has closed a little.
And here is a monthly graph of active inventory from Realtor.com. In May, active inventory was up 35.2% year-over-year.
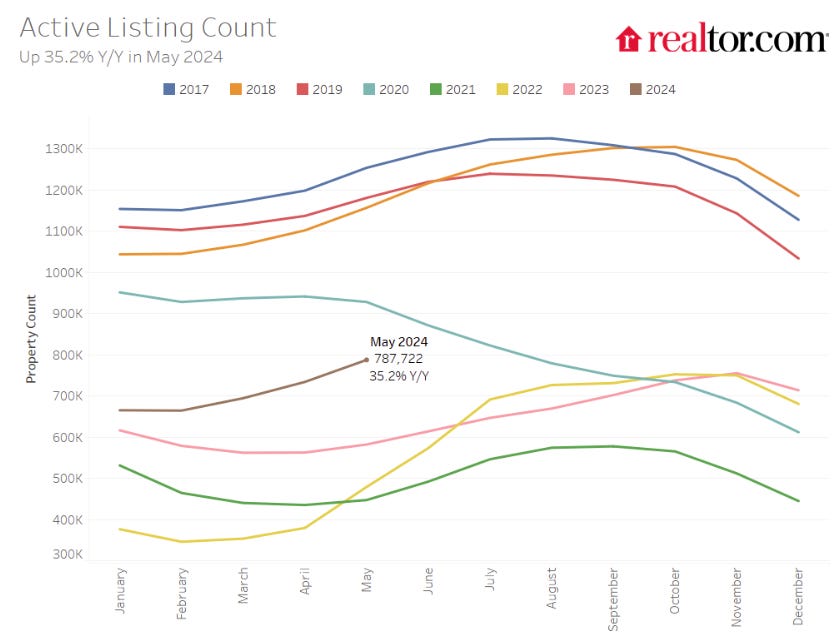
As I recently noted, months-of-supply is important to watch, and it is possible months-of-supply will be back to 2019 levels later this year. As months-of-supply increases, the year-over-year change in house prices will slow.
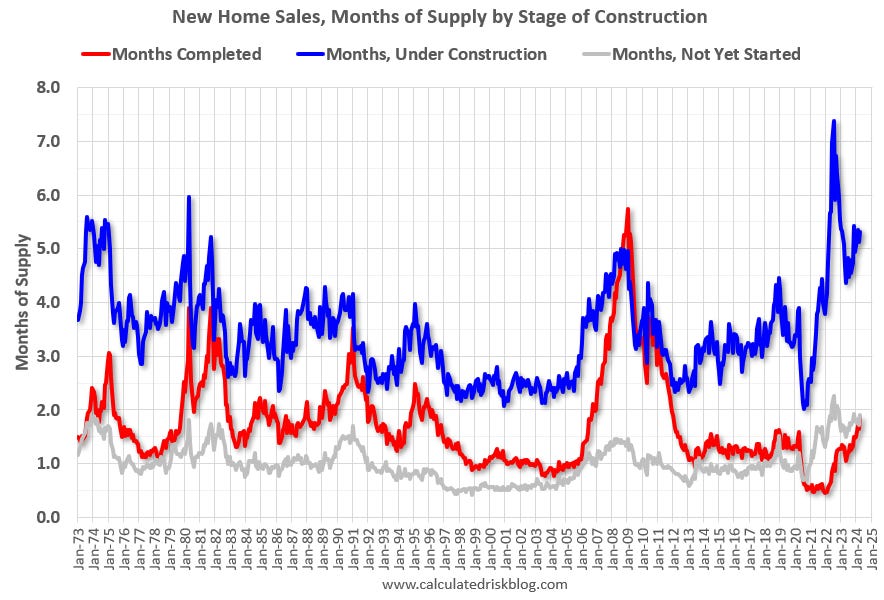
Over 5 Months of New Home Unsold Inventory Under Construction
For new homes, there are over 5 months of homes are under construction (blue line below) – well above the normal level. There are 1.9 months of completed supply (red line). This is slightly above the normal level.
New home inventory is close to a record percentage of total inventory. The following graph uses Not Seasonally Adjusted (NSA) existing home inventory from the National Association of Realtors® (NAR) and new home inventory from the Census Bureau (only completed and under construction inventory).
Note: Mark Fleming, Chief Economist at First American pointed this out in March 2023.
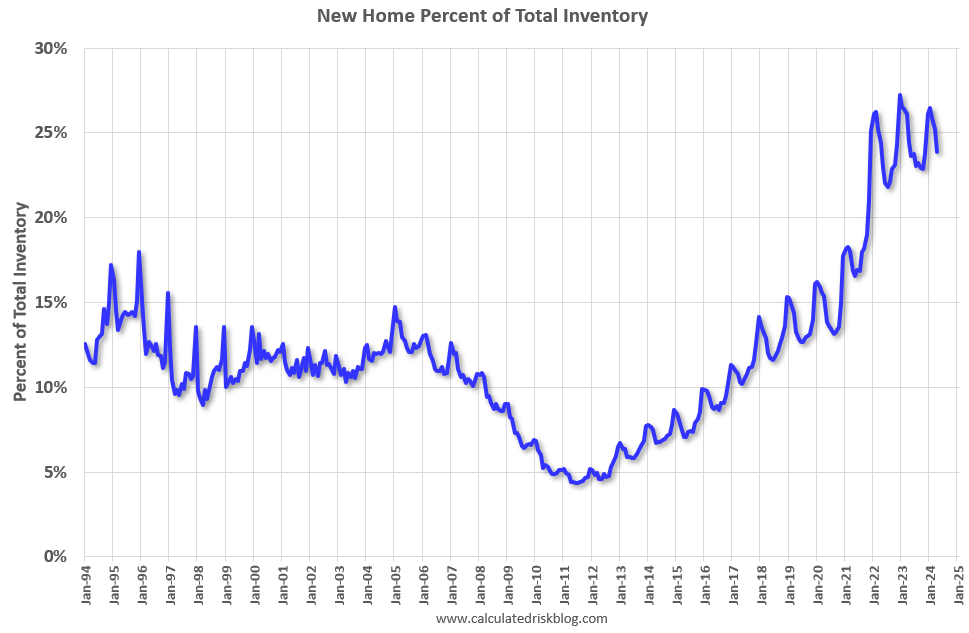
It took a number of years following the housing bust for new home inventory to return to the pre-bubble percent of total inventory. Then, with the pandemic, existing home inventory collapsed and now the percent of new homes is 23.9% of the total for sale inventory, down from a peak of 27.2% in December 2022. The percent of new homes of total inventory should decline this year as existing home inventory increases in 2024.
Note that the lack of existing home inventory, and few distressed sales, has been a positive for homebuilders.
And for housing starts there are a near record number of multi-family housing units under construction, and 1.616 million total units under construction. Multi-Family housing units under construction has peaked!

Red is single family units. Currently there are 682 thousand single family units (red) under construction (SA). This was down in April compared to March, and 148 thousand below the pandemic peak in May 2022. Blue is for 2+ units. Currently there are 934 thousand multi-family units under construction. This is 87 thousand below the record set in July 2023 of 1,021 thousand.
Combined, there are 1.616 million units under construction, 95 thousand below the all-time record of 1.711 million set in October 2022.
Sales
The NAR reported sales were at a “seasonally adjusted annual rate of 4.14 million in April. Year-over-year, sales fell 1.9% (down from 4.22 million in April 2023).” This was close to the local markets I tracked for April.
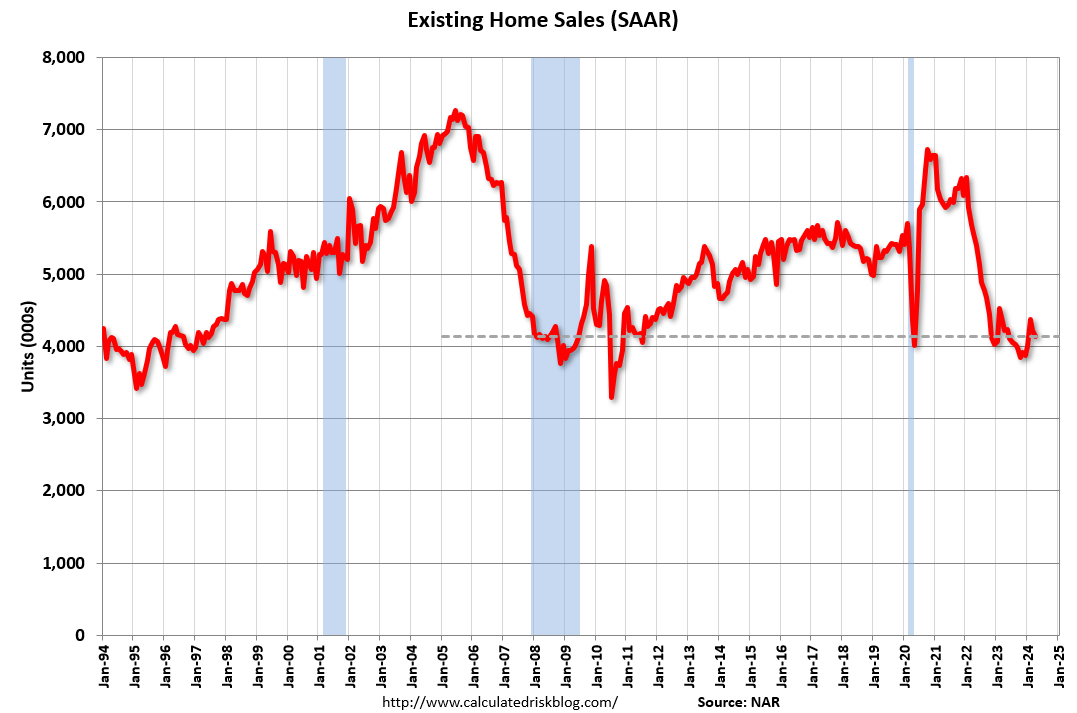
Early local market data for May suggests that the May existing home sales report might show a year-over-year increase following 32 consecutive months with a YoY decline in sales.
And for new home sales, the Census Bureau reported “Sales of new single‐family houses in April 2024 were at a seasonally adjusted annual rate of 634,000”, down 7.7% YoY from April 2023.
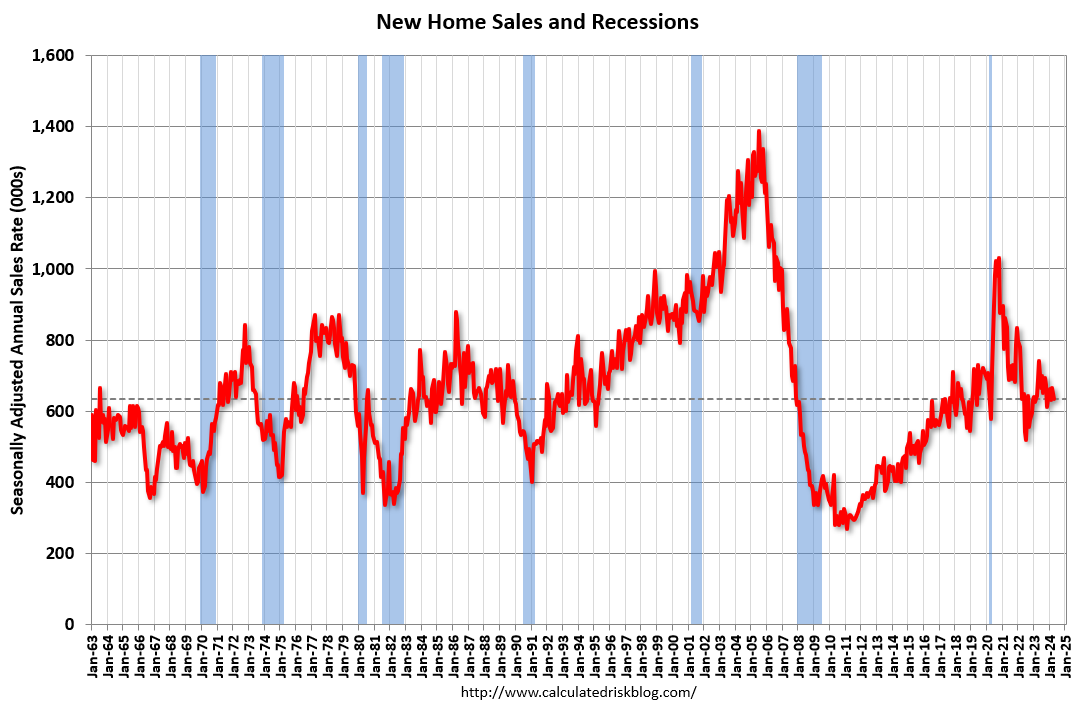
New home sales bottomed in July 2022. New home sales are holding up better than existing home sales due to the lack of existing home inventory and the lack of distressed sales this cycle – and new home builders are using various tools to attract buyers such as mortgage rate buydowns.
2024 Outlook
In December I posted some questions on my blog for 2024: Ten Economic Questions for 2024. Some of these questions concern real estate (inventory, house prices, housing starts, new home sales). So far, the outlook remains the same: Existing home inventory will likely increase in 2024 but remain well below normal levels. Multi-family starts will likely decline further – although completions will increase.
In Part 2, I’ll discuss house prices, rents, mortgage rates, and more.