CALCULATEDRISK
By Bill McBride
This 2-part overview for mid-May provides a snapshot of the current housing market.
Right now, the key story for existing homes is that inventory is increasing sharply, and sales are essentially flat compared to last year. That means prices will be under pressure (although there will not be a huge wave of distressed sales).
Yesterday, Realtor.com reported that there were “more than 1 million homes for sale last week, crossing this threshold for the first time since December 2019”.
New Listings for Existing Homes Up Year-over-year in April
Realtor.com reports in April 2025 Monthly Housing Market Trends Report that new listings were up 9.2% year-over-year in April. And active listings were up 30.6% year-over-year.
Homebuyers found more options in April, as the number of actively listed homes rose 30.6% compared with the same time last year. This marks the 17th consecutive month of year-over-year inventory gains and builds on March’s 28.5% increase. For the first time, the number of homes for sale in April surpassed April 2020 levels—a key pandemic benchmark. Despite this progress, active inventory remains 16.3% below typical 2017–19 levels, signaling that the market still has ground to cover. That said, April’s gains suggest the market is closing that gap more quickly than before.
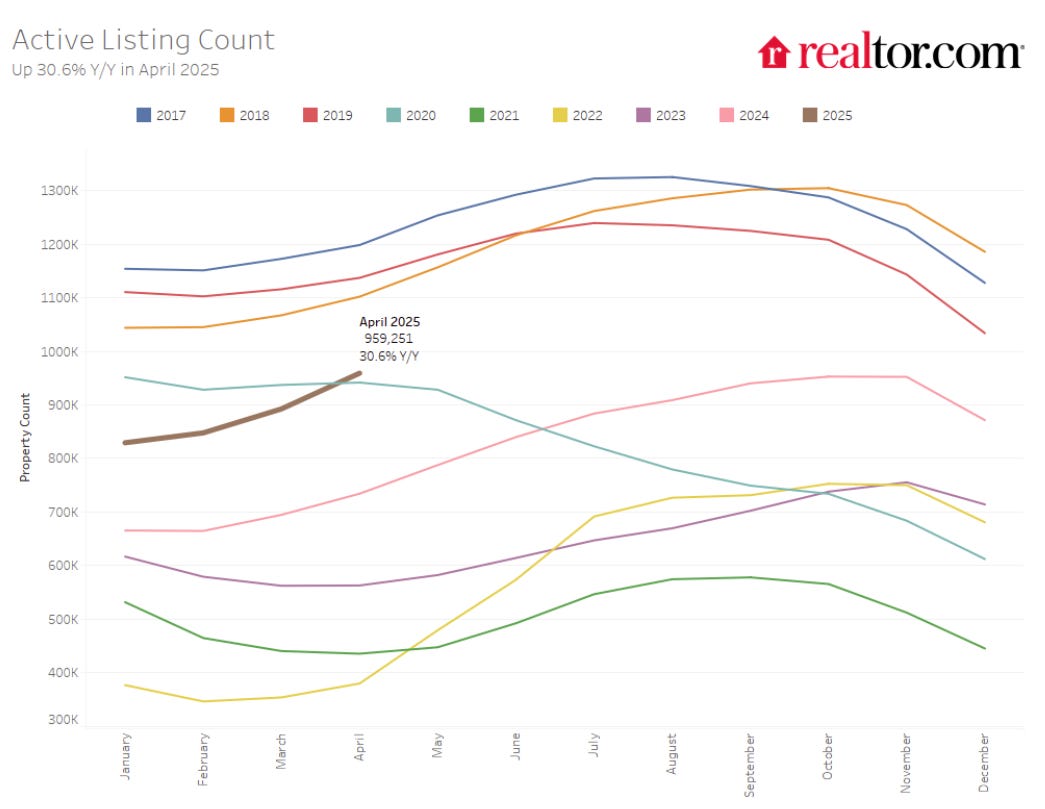
Note the seasonality for active listings. The next few months will be the key for inventory, and it now appears inventory will be back to 2019 levels by the end of 2025.
The following graph shows the seasonal pattern for active single-family inventory since 2015 through May 2, 2025, from Altos Research. The red line is for 2025. The black line is for 2019.
Inventory was up 32.9% compared to the same week in 2024, and down 16.0% compared to the same week in 2019. Inventory passed 2020 same week levels this week and is also above the peak for last year (2024).

Months-of-Supply
Since inventory has increased sharply and sales are flat, a key for house prices is to watch months-of-supply. The following graph shows months-of-supply since 2017 using data from the NAR. Note that months-of-supply is higher than the previous 8 years!
Months-of-supply was at 4.0 months in March compared to 3.8 months in March 2019.
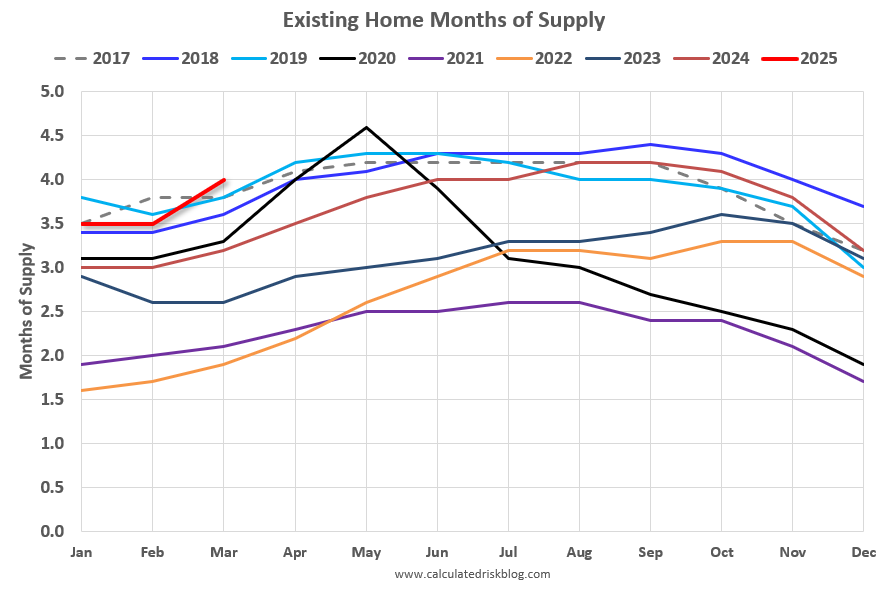
Inventory would probably have to increase to 5 1/2 to 6 months of supply to see national price declines.
In 2022, we saw some price declines at the National level even with fairly low months-of-supply – probably due to the sharp increase in inventory and some sellers panicking while remembering the housing bust!
There are significant regional differences in months-of-supply. Here is a table of the local markets I follow for March 2025. Note: I broke out Miami (Miami-Dade) from the “Miami Area” this also includes Broward County and Palm Beach.
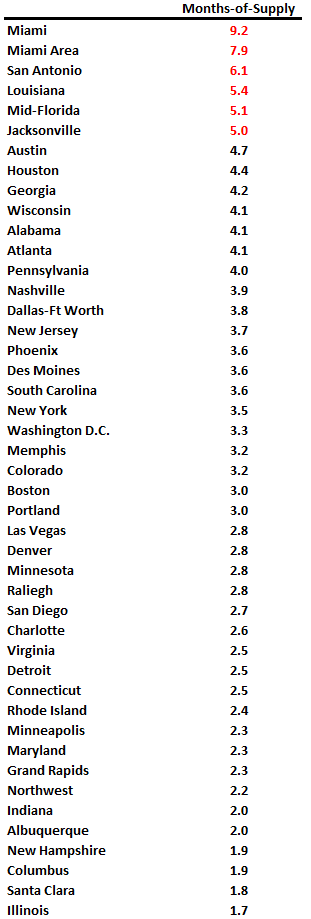
Months in red will likely see 6+ months of supply this summer and might see price pressures. There is nothing magical about 6 months; some areas see price declines with less inventory, some more. Florida and Texas are the most at-risk states for price declines in 2025.
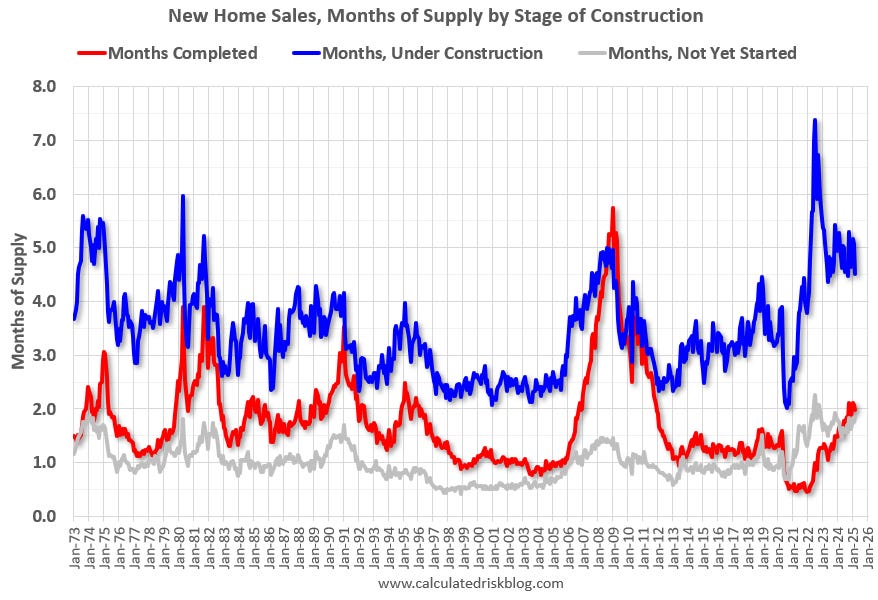
4 1/2 Months of New Home Unsold Inventory Under Construction
For new homes, there are 4 1/2 months of homes are under construction (blue line below) – generally declining, but still well above the normal level. There are 2.0 months of completed supply (red line). This is above the normal level.
New home inventory, as a percentage of total inventory, is still very high. The following graph uses Not Seasonally Adjusted (NSA) existing home inventory from the National Association of Realtors® (NAR) and new home inventory from the Census Bureau (only completed and under construction inventory).
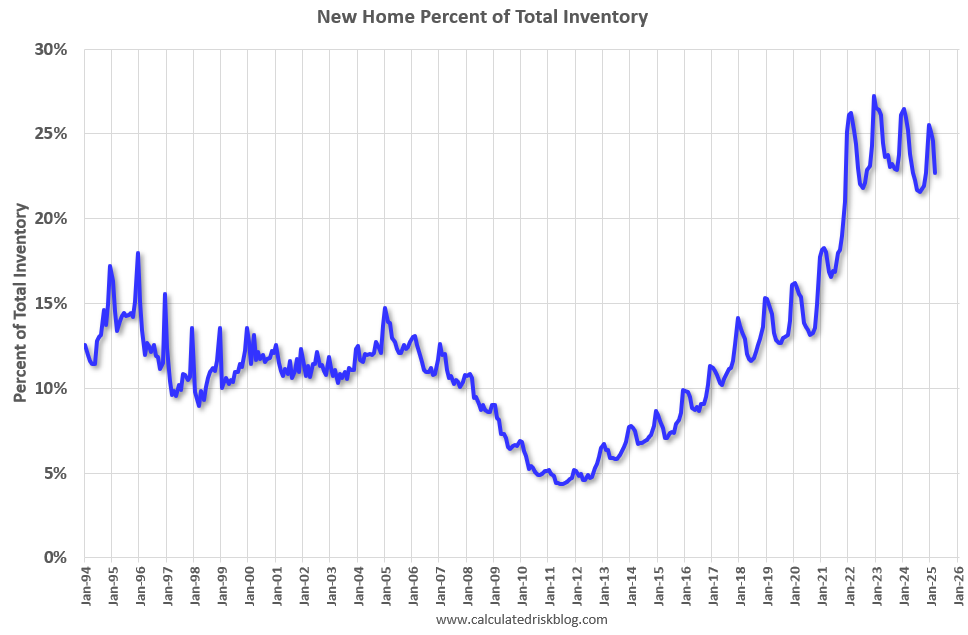
It took a number of years following the housing bust for new home inventory to return to the pre-bubble percent of total inventory. Then, with the pandemic, existing home inventory collapsed and now the percent of new homes is 22.7% of the total for sale inventory, down from 25.2% a year ago in March 2024, and down from a peak of 27.2% in December 2022.
The percent of new homes of total inventory should continue to decline as existing home inventory increases.
And for housing starts there are still an above normal number of multi-family housing units under construction, and 1.391 million total units under construction.

Currently there are 632 thousand single family units (red) under construction (SA). And there are 759 thousand multi-family units (blue) under construction. Combined, there are 1.391 million units under construction, 320 thousand below the all-time record of 1.711 million set in October 2022.
In the three years prior to the pandemic, there were about 1.1 to 1.2 million housing units under construction – so the current level is still historically high. And there will likely be a decline in demand in 2025.
Sales
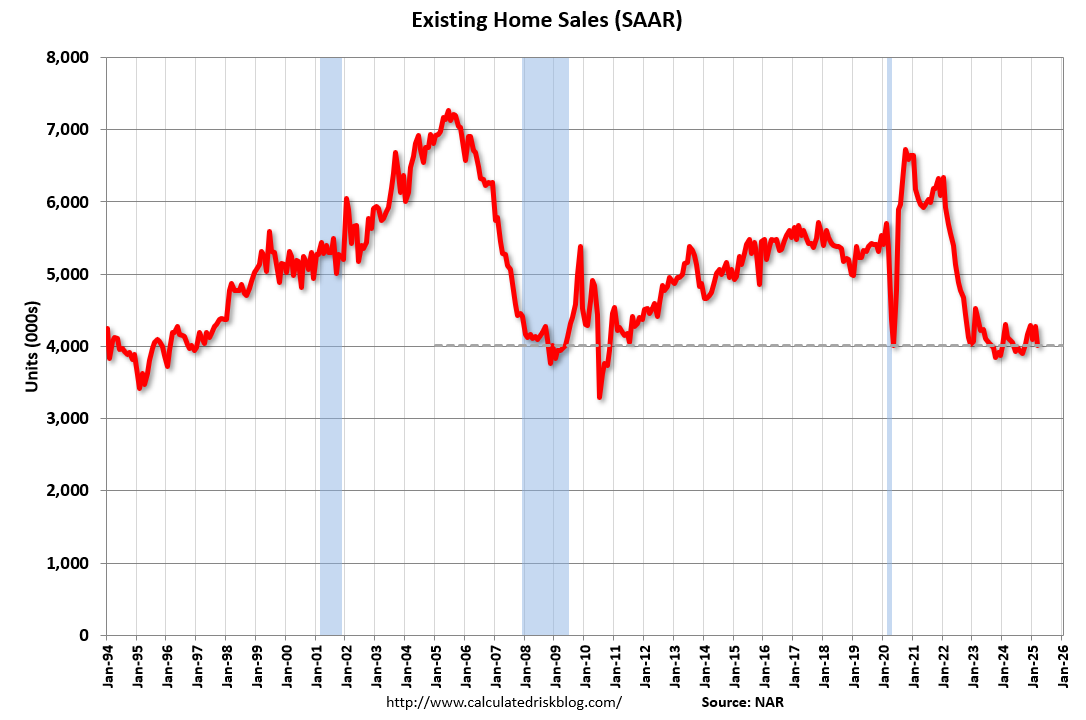
The NAR reported sales were at a “seasonally adjusted annual rate of 4.02 million in March”. As expected, existing home sales were down year-over-year for the 2nd consecutive month.
Early local market reports suggest existing home sales will likely be down year-over-year again in April.
And for new home sales, the Census Bureau reported “Sales of new single-family houses in March 2025 were at a seasonally-adjusted annual rate of 724,000”, up 6.0% YoY from March 2024.
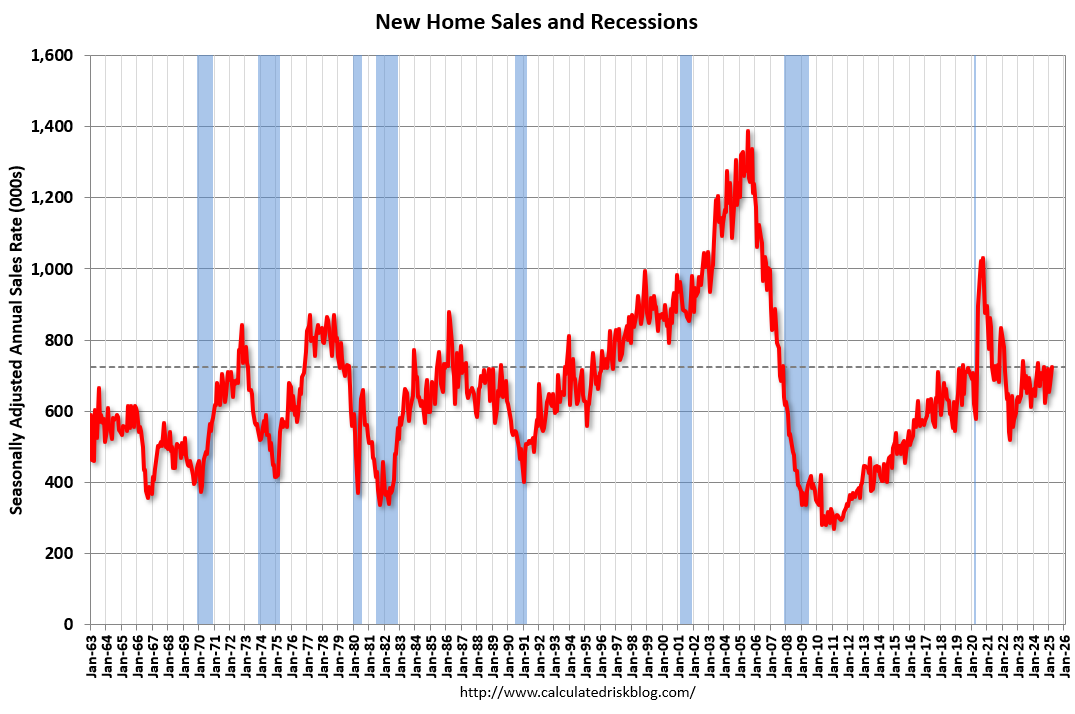
If policy changes hit the housing market, it will likely show up in new home sales first – since new home sales are reported when the contract is signed (existing home sales are reported when the contract closes).
A key for house prices will be to watch existing home months-of-supply!
In Part 2, I’ll review house prices, rents, mortgage rates, and more.