Part 1: Current State of the Housing Market; Overview for mid-October
CALCULATEDRISK
By Bill McBride
In this 2-part overview of the housing market for mid-October, I’ll discuss new and existing home inventory and sales, house prices, mortgage rates, rents and more.
Year-over-year Decline in New Listings
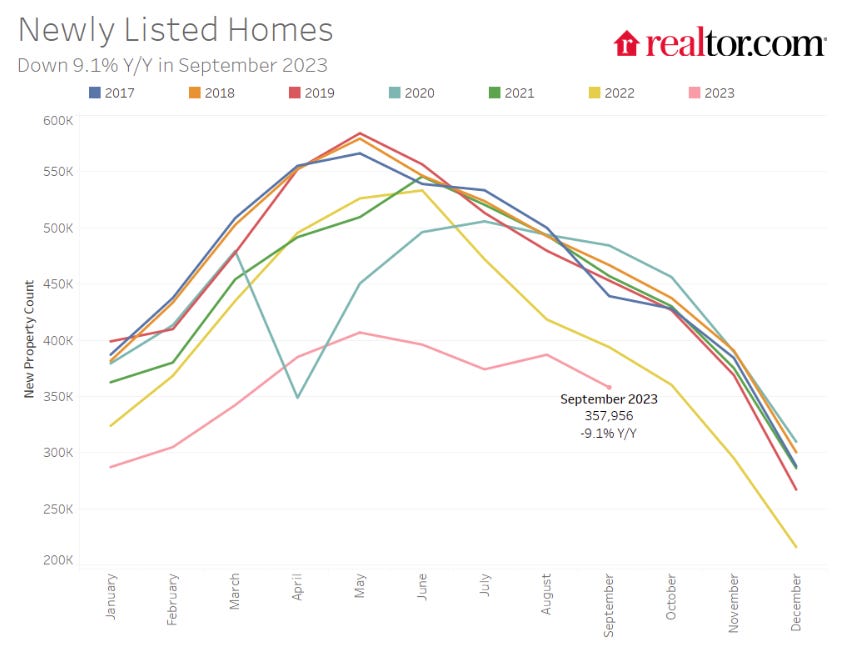
Here is a graph of new listing from Realtor.com’s September 2023 Monthly Housing Market Trends Report showing new listings were down about 9.1% year-over-year in September. The year-over-year decline was much smaller in August and September than in previous months, mostly because new listings collapsed in the 2nd half of 2022. From Realtor.com:
Newly listed homes were 9.1% below last year’s levels, slowing from a decline of 7.5% in August. While newly listed homes showed an unusual seasonal increase from July to August, higher mortgage rates and more typical seasonality reset the trend to a decline from August to September. Higher mortgage rates impact selling activity through homeowners feeling ‘locked-in’ to previously low rates and thus the inventory of existing homes continued to be limited this past month.
For the local markets I track that have reported so far, are show new listings were down significantly less in August and September than in the previous months.
For these areas, new listings were down 17.0% YoY. … Last month, new listings in these markets were down 18.5% YoY. The YoY decline in new listing has been getting smaller, mostly because new listings collapsed a year ago as mortgage rates increased. This is historically a low level of new listings.
Impact on Active Inventory
The following graph shows the seasonal pattern for active single-family inventory since 2015 from Altos Research. The red line is for 2023. The black line is for 2019.
Inventory was down 4.3% compared to the same week in 2022 (last week it was down 4.7%), and down 43.8% compared to the same week in 2019 (last week down 43.9%). In 2022, inventory didn’t peak until late October, and it appears likely same week inventory will be below 2022 levels for the remainder of the year.
It also seems likely that inventory will be close to or above 2020 levels (dark blue line) by the end of the year, but still historically very low.
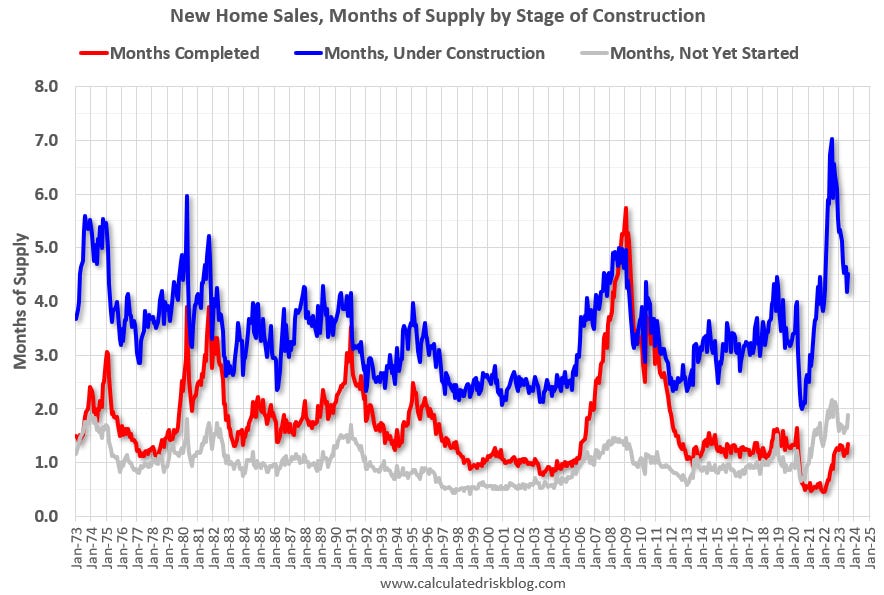
For new homes, there are 4 1/2 months of homes under construction (blue line below) – well above the normal level, but declining. This elevated level of homes under construction is due to supply chain constraints. There are 1.4 months of completed supply (red line). This is close to the normal level.
Interestingly, new home inventory is close to a record percentage of total inventory.
This graph uses Not Seasonally Adjusted (NSA) existing home inventory from the National Association of Realtors® (NAR) and new home inventory from the Census Bureau (only completed and under construction inventory).
Note: Mark Fleming, Chief Economist at First American pointed this out in March.
It took a number of years following the housing bust for new home inventory to return to the pre-bubble percent of total inventory. Then, with the pandemic, existing home inventory collapsed and now the percent of new homes is 23% of the total for sale inventory. The lack of existing home inventory, and few distressed sales, has been a positive for homebuilders.
And for housing starts there are a nearrecord number of multi-family housing units under construction, and a near record 1.688 million total units under construction.
Red is single family units. Currently there are 676 thousand single family units (red) under construction (SA). Blue is for 2+ units. Blue is for 2+ units. Blue is for 2+ units. Currently there are 1,012 thousand multi-family units under construction. This is slightly below the record set last month of 1,014 thousand.
Combined, there are 1.688 million units under construction, just 22 thousand below the all-time record of 1.710 million set in October 2022.
Sales
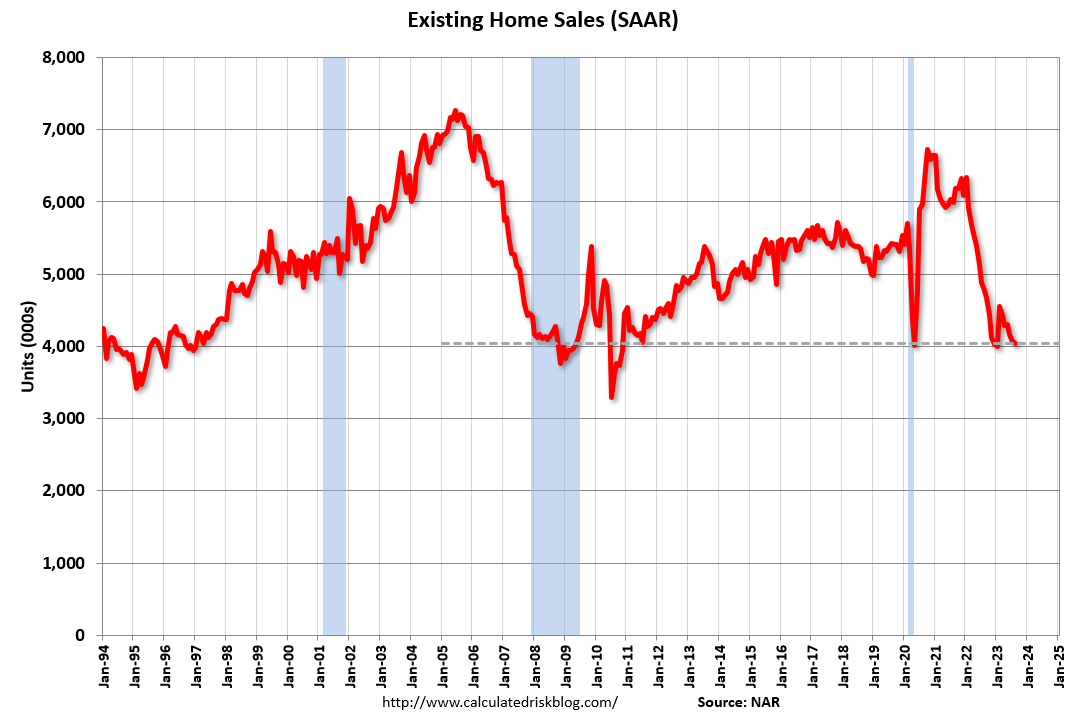
The NAR reported sales were at a “seasonally adjusted annual rate of 4.04 million in August. Year-over-year, sales fell 15.3% (down from 4.77 million in August 2022).” This was in line with the local markets I tracked for August.
The current cycle low for existing home sales was 4.00 million SAAR in January 2023. The early local market reports suggest a new cycle low for closed sales in September!
Usually, house prices bottom after sales bottom, so a new cycle low for sales suggests likely further weakness for house prices in coming months. I’ll have more on this pattern.
And the Census Bureau reported “Sales of new single‐family houses in August 2023 were at a seasonally adjusted annual rate of 675,000”, up 5.8% YoY from August 2022.
New home sales have likely bottomed although the recent spike in mortgage rates is impacting sales. New home sales are holding up better than existing home sales due to the lack of existing home inventory and the lack of distressed sales this cycle – and new home builders are using various tools to attract buyers such as 3-2-1 mortgage rate buydowns (the home builders buy down a 7% mortgage to 4% the 1st year, 5% the 2nd, and 6% the 3rd year). However, the home buyers still must qualify at the current fully amortized rate.
Rick Palacios Jr., Director of Research at JBREC, posted this about new home sales last week:
Home builders not too happy watching market mortgage rates grind higher day after day. Buying rates down from 7.5%+ is getting increasingly expensive. Resale listings also finally rising should make Q4 backdrop for builders a bit different than YTD.
In Part 2, I’ll discuss mortgage rates, house prices, rents and more.