Part 1: Current State of the Housing Market; Overview for mid-September
CALCULATEDRISK
By Bill McBride
In this 2-part overview of the housing market for mid-September, I’ll discuss new and existing home inventory and sales, house prices, mortgage rates, rents and more.
Year-over-year Decline in New Listings Smaller in August
Here is a graph of new listings from Realtor.com’s August 2023 Monthly Housing Market Trends Report showing new listings were down about 7.5% year-over-year in August. The year-over-year decline was much smaller in August than in July (down 20.8%). From Realtor.com:
Newly listed homes were 7.5% below last year’s levels, but this rate of decline is much improved from a decline of 20.8% in July. Some of this improvement can be attributed to rapidly dwindling listing activity late last summer through to the end of the year as sellers, ‘locked-in’ by previously lower mortgage rates, opted to wait to list their homes. However, the count of newly listed homes did increase by 3.5% from July to August. This late-summer increase in newly listed homes is seasonally unusual and while the increase was not large, an increase in newly listed homes provides more choices for buyers who have been struggling with affordability this year.
For the local markets I track that have reported so far, are show new listings were down significantly less in August than in the previous months.
For these areas, new listings were down 12.4% YoY. … Last month, new listings in these markets were down 24.9% YoY. The decline in new listing in August – for these areas – was smaller than the YoY decline for the last several months.
Impact on Active Inventory
The following graph shows the seasonal pattern for active single-family inventory since 2015 from Altos Research. The red line is for 2023. The black line is for 2019.
Inventory was down 6.9% compared to the same week in 2022 (last week it was down 7.9%), and down 47.0% compared to the same week in 2019 (last week down 46.2%). It appears same week inventory will be below 2022 levels for the remainder of the year. It is possible that inventory might be close to 2020 levels (dark blue line) by the end of the year.
For new homes, there are almost 4 1/2 months of homes under construction (blue line below) – well above the normal level, but declining. This elevated level of homes under construction is due to supply chain constraints. There are 1.3 months of completed supply (red line). This is close to the normal level.
Interestingly, new home inventory is close to a record percentage of total inventory. This graph uses Not Seasonally Adjusted (NSA) existing home inventory from the National Association of Realtors® (NAR) and new home inventory from the Census Bureau (only completed and under construction inventory).
Note: Mark Fleming, Chief Economist at First American pointed this out in March.
It took a number of years following the housing bust for new home inventory to return to the pre-bubble percent of total inventory. Then, with the pandemic, existing home inventory collapsed and now the percent of new homes is close to 23% of total for sale inventory. The lack of existing home inventory, and few distressed sales, has been a positive for homebuilders.
And for housing starts there are a record number of multi-family housing units under construction, and a near record 1.681 million total units under construction.
Red is single family units. Currently there are 678 thousand single family units (red) under construction (SA). Blue is for 2+ units. Blue is for 2+ units. Currently there are 1,003 thousand multi-family units under construction. This breaks the record set in July 1973 of multi-family units being built for the baby-boom generation.
Combined, there are 1.681 million units under construction, just 29 thousand below the all-time record of 1.710 million set in October 2022.
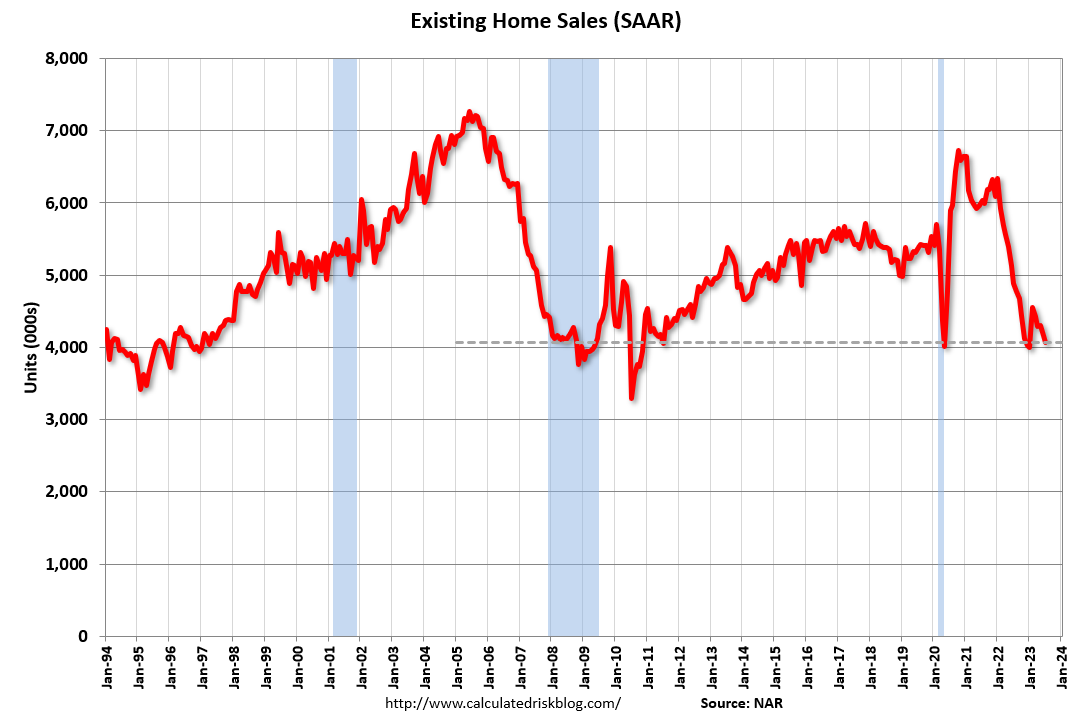
Sales
The NAR reported sales were at a “seasonally adjusted annual rate of 4.07 million in July”. Year-over-year, sales slumped 16.6% (down from 4.88 million in July 2022).” This was in line with the local markets I tracked for July.
The early local market reports suggest a smaller year-over-year decline in closed sales NSA in August. Since sales were declining all year in 2022, the YoY decline will shrink even if sales are flat in 2023.
It is possible that existing home sales, seasonally adjusted, bottomed in December and January. However, with the recent increase in mortgage rates, existing home sales might fall below the current cycle low of 4.0 million SAAR in January 2023.
And the Census Bureau reported “Sales of new single‐family houses in July 2023 were at a seasonally adjusted annual rate of 714,000”, up 31.5% YoY from July 2022.
New home sales have likely bottomed and appear to be increasing (unlike existing home sales that is mostly flat at a low level). This is because new home sales are holding up better than existing home sales due to the lack of existing home inventory and the lack of distressed sales this cycle – and new home builders are using various tools to attract buyers such as 3-2-1 mortgage rate buydowns (the home builders buy down a 7% mortgage to 4% the 1st year, 5% the 2nd, and 6% the 3rd year). However, the home buyers still must qualify at the current fully amortized rate.
Rick Palacios Jr., Director of Research at JBREC, posted this about August new home sales this week:
Sales for new and existing homes are on divergent paths!
In Part 2, I’ll discuss mortgage rates, house prices, rents and more.