CALCULATEDRISK
By Bill McBride
In Part 1: Current State of the Housing Market; Overview for mid-December 2025 I reviewed home inventory and sales. I noted that the key stories this year for existing homes are that inventory increased sharply (almost back to pre-pandemic levels), and sales are depressed and tracking last year (sales in 2024 were the lowest since 1995). That means prices are under pressure.
In Part 2, I will look at house prices, mortgage rates, rents and more.
The house price trend suggests house prices will be mostly unchanged year-over-year by the end of 2025. However, there are two powerful forces pushing in opposite directions – mortgage rates have declined year-over-year, and unemployment is increasing (rising to 4.6% in the November report released this morning). Both could impact sales and house prices.
Lower mortgage rates have led to a pickup in purchase mortgage applications, but this hasn’t led to significantly more sales, at least not yet.
House Prices
The Case-Shiller National Index increased 1.3% year-over-year (YoY) in September and will likely be about the same year-over-year in the October report compared to September (based on other data).
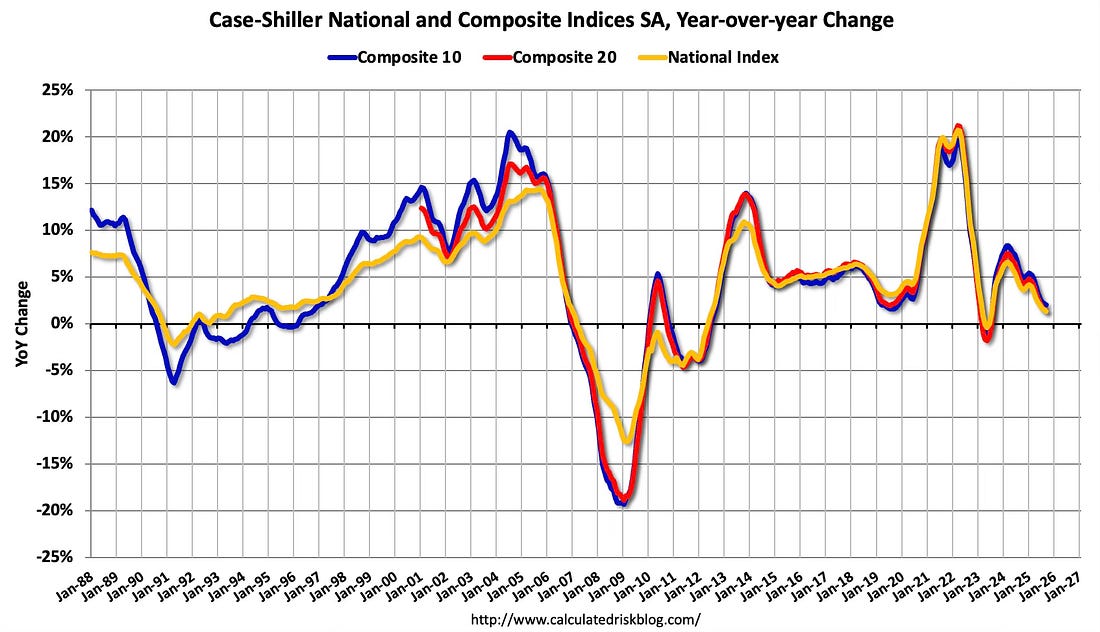
The Composite 10 NSA was up 2.0% year-over-year. The Composite 20 NSA was up 1.4% year-over-year. The National index NSA was up 1.3% year-over-year.
The Month-over-month (MoM) increase in the seasonally adjusted (SA) Case-Shiller National Index was at 0.22% (a +2.6% annual rate). This was the 2nd consecutive MoM increase following five consecutive MoM decreases in the seasonally adjusted index.
In the January report, the Case-Shiller National index was up 4.2%, in February up 4.0%, in March up 3.4%, in April report up 2.8%, in May up 2.3%, in June up 1.9% in July up 1.6%, August up 1.6% and in September up 1.3% (a steady decline in the YoY change).
And the September Case-Shiller index was a 3-month average of closing prices in July, August and September. July closing prices include some contracts signed in May. So, not only is this trending down, but there is a significant lag to this data.
Let’s review some more timely house price data …
Other measures of house prices suggest prices will be up about the same YoY in the October Case-Shiller index as in the September report. The NAR reported median prices were up 2.1% YoY in October, up from 1.4% YoY in September. (Note that median prices are impacted by the mix).
ICE reported prices were up 0.8% YoY in November. Freddie Mac reported house prices were up 1.0% YoY in October, down from 1.1% YoY in September.
Here is a comparison of year-over-year change in the FMHPI, median house prices from the NAR, and the Case-Shiller National index.
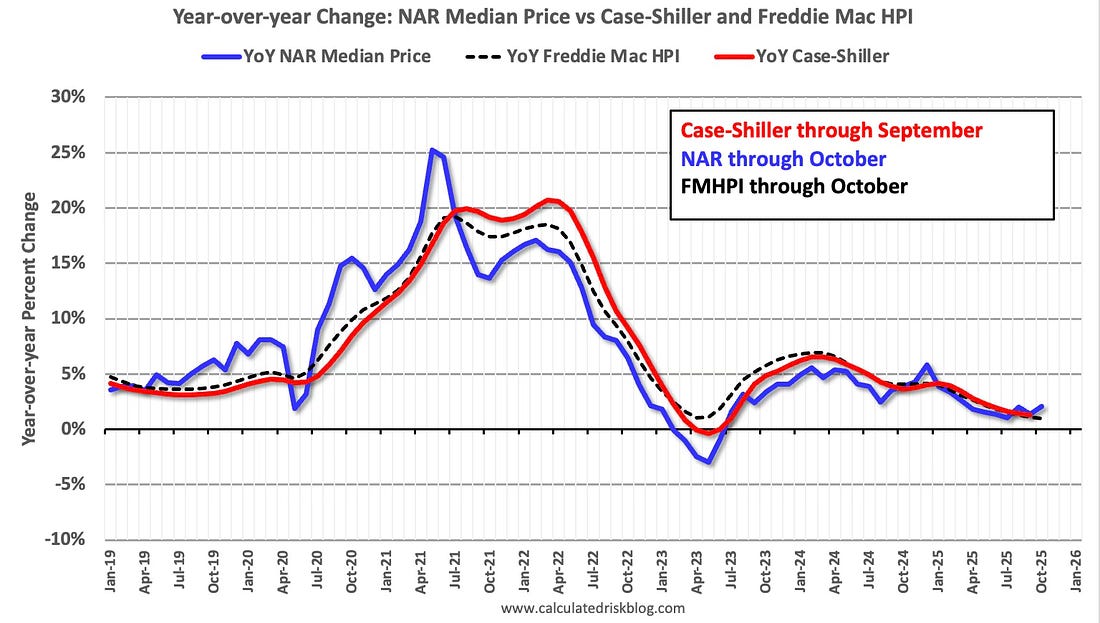
The FMHPI is suggesting the Case-Shiller index will likely be up about the same year-over-year in the October report compared to September.
In real terms, the Case-Shiller National index is down 3.0% from the peak in 2022, seasonally adjusted. It has now been 39 months since the real peak in house prices. Typically, after a sharp increase in prices, it takes a number of years for real prices to reach new highs.
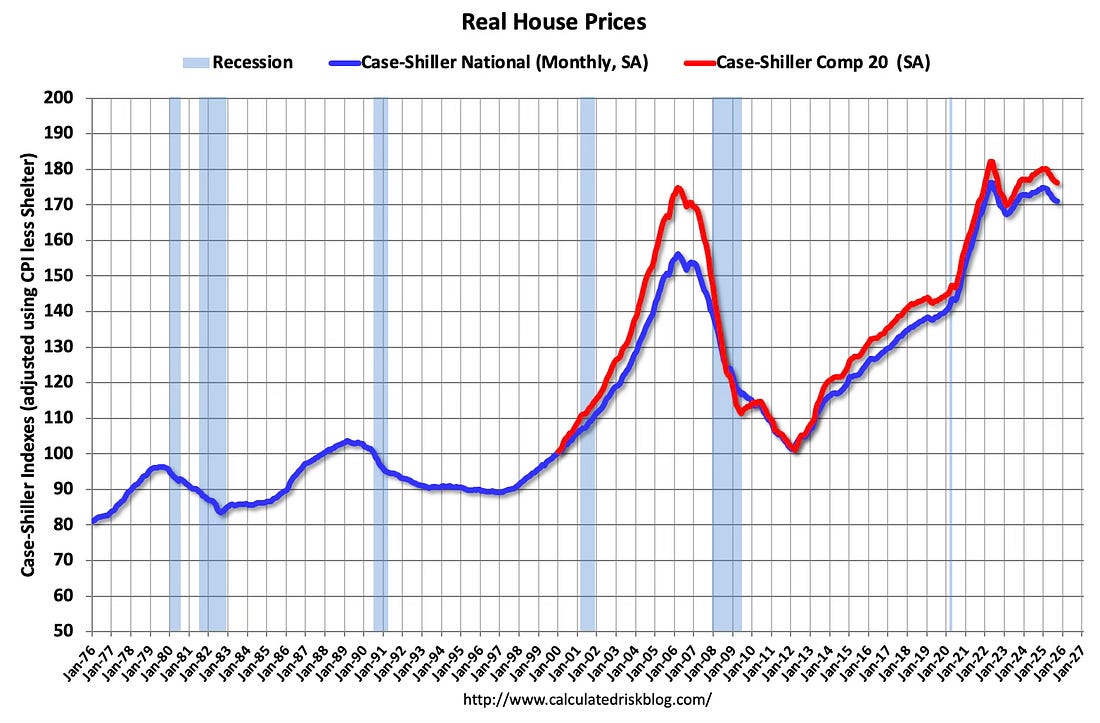
Both the real National index and the Comp-20 index decreased in September. The real National index has decreased for 9 consecutive months.
30-Year Mortgage Rates Near Low End of 3-Year Range
The following graph from MortgageNewsDaily.com shows mortgage rates since January 1, 2000. 30-year mortgage rates were at 6.29% on December 15th. This is slightly above the recent lows, but near the low of the range for the last 3 years.
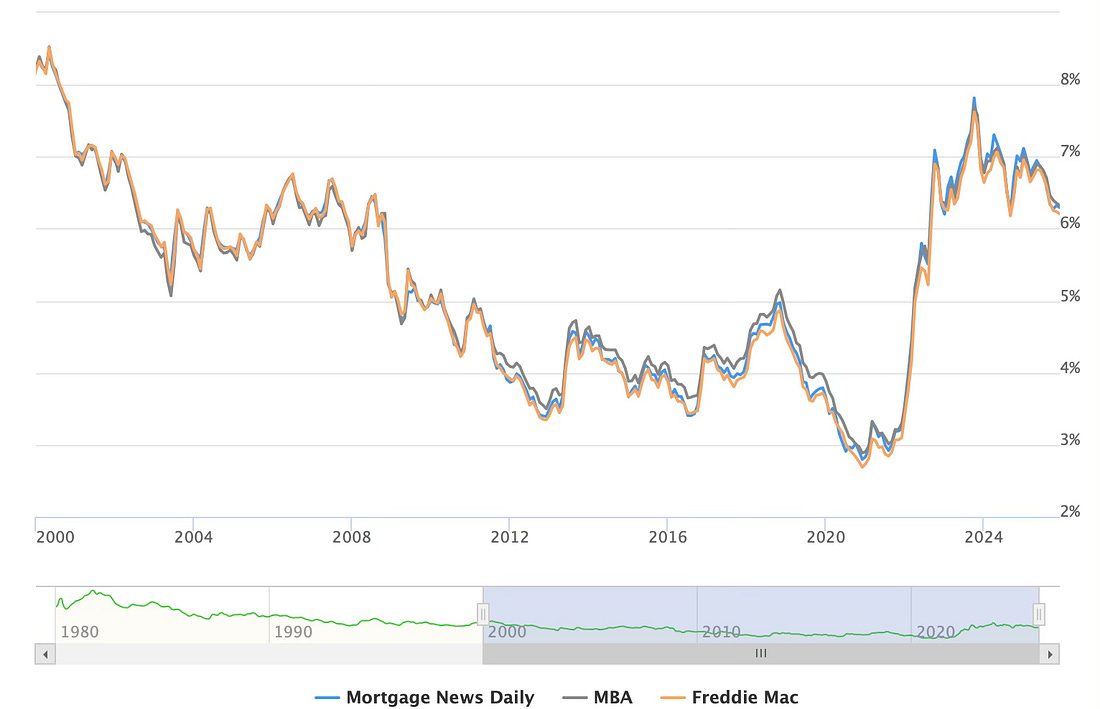
Mortgage rates were low following the financial crisis through the early years of the pandemic. Now rates have returned to a new normal in 30-year mortgage rates in the 6% to 7% range.
A year ago, 30-year mortgage rates were at 6.93%, two years ago rates were at 6.65%, three years ago rates at 6.13%, and four years ago at 3.18%.
It is financially very difficult for homeowners that bought or refinanced in 2020 and 2021 to move and give up their 3% mortgage rates, however time and life changes are slowly leading to more listings.
Mortgage Purchase Applications Have Increased
Here is a graph showing the MBA mortgage purchase index released this week. Purchase application activity is up from the lows in late October 2023 and is above the lowest levels during the housing bust.
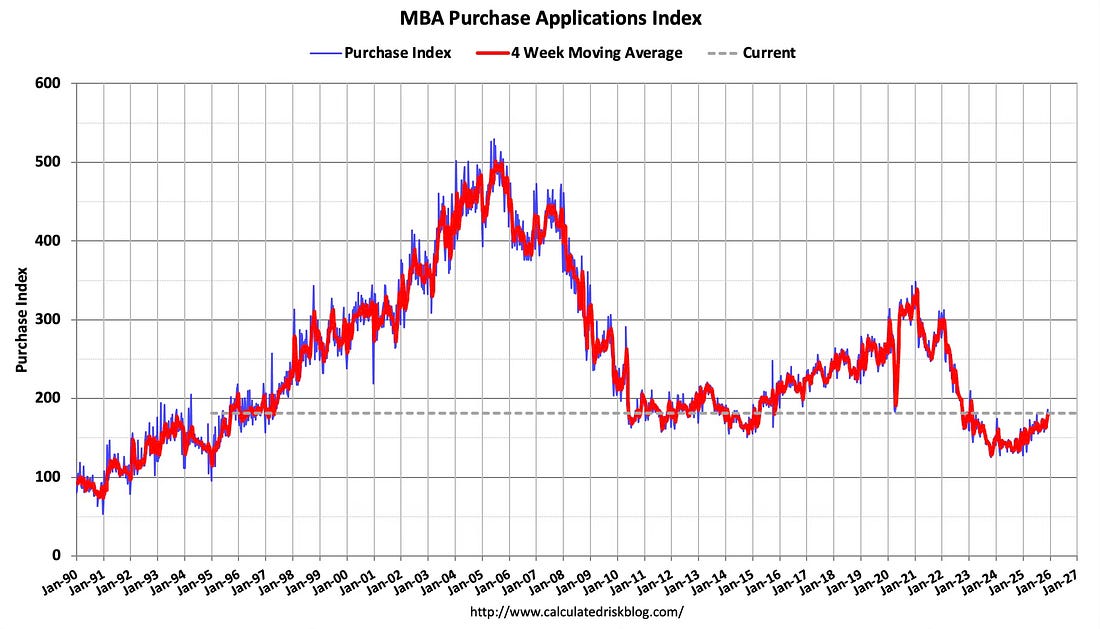
This is still very low, but increasing.
And the next graph shows the refinance index since 1990. Refinance activity is still very low but picking up a little with lower mortgage rates.
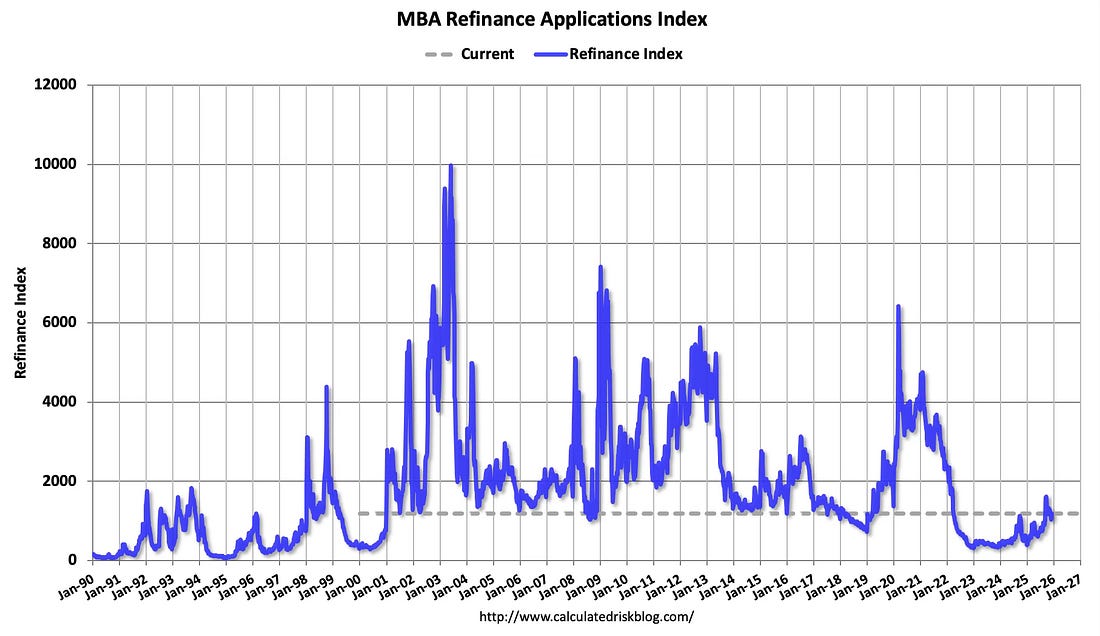
Many of the homebuyers in the last few years have been able to refinance recently.
Asking Rents Mostly Unchanged Year-over-year
Here is a graph of the year-over-year (YoY) change for these measures since January 2015. The government measures are through September 2025 (October data hasn’t been released due to the government shutdown). Zillow is through October, and Apartment List is through November 2025.
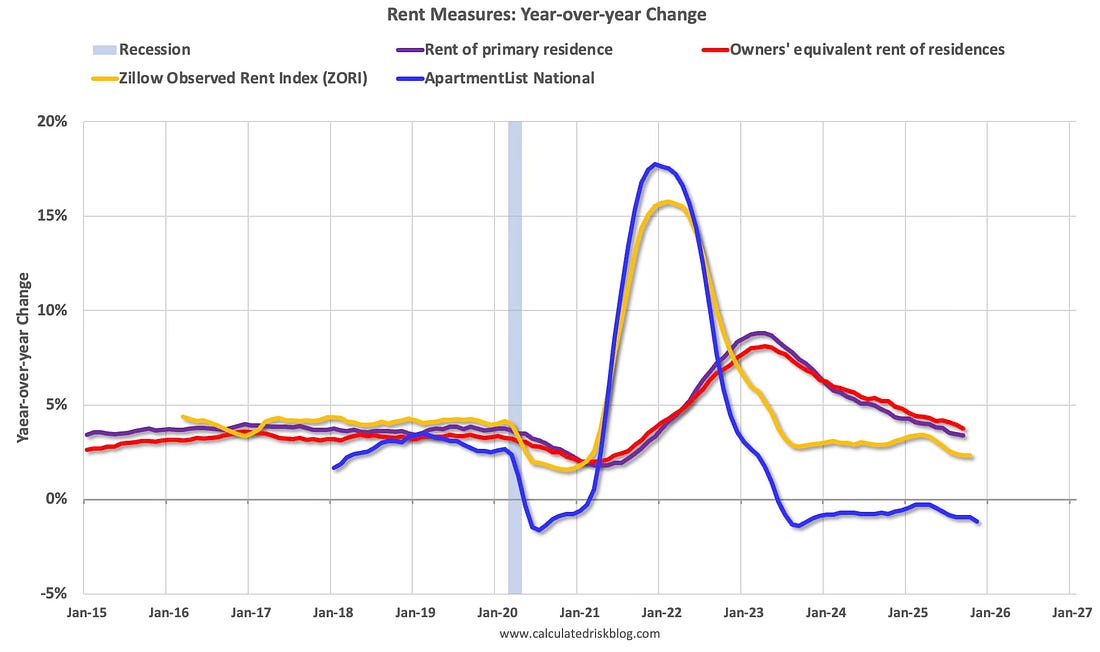
The Zillow measure (single and multi-family) is up 2.3% YoY in October, down from 2.4% YoY in September, and down from a peak of 15.6% YoY in February 2022.
The ApartmentList measure is -1.1% YoY as of November, down from -0.9% in October, and down from a peak of 17.8% YoY December 2021.
Asking rents are mostly unchanged YoY for multi-family and with new supply coming on the market (although at a lower level than last year), we will likely see continued pressure on asking rents. It is possible that policy (less immigration, more deportations) could also put downward pressure on rents.
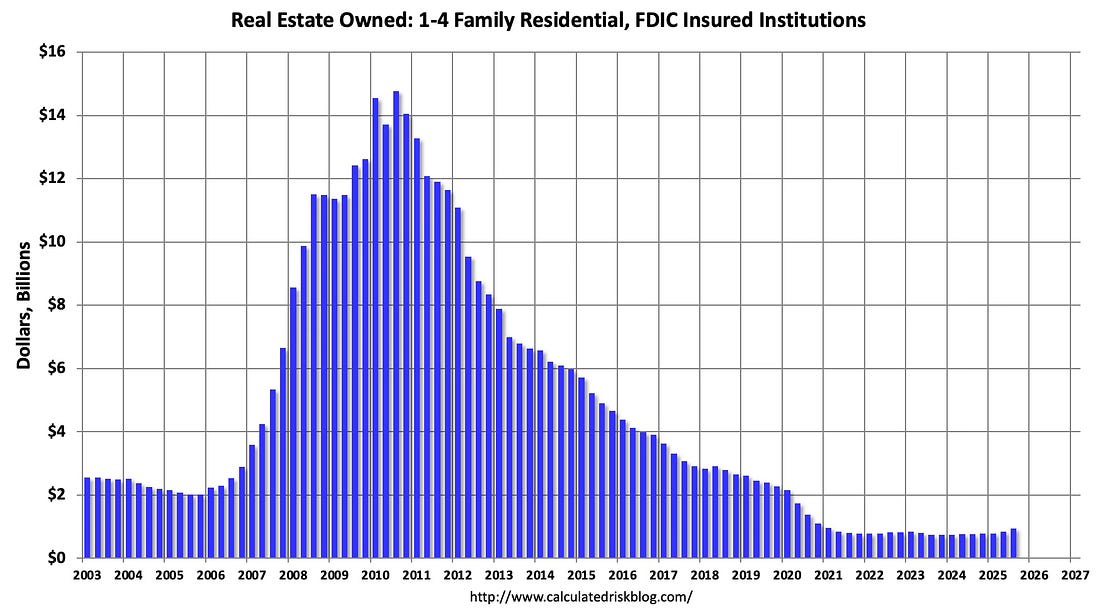
Delinquencies and Foreclosures Remain Low
This graph shows the nominal dollar value of Residential REO for FDIC insured institutions based on the Q3 FDIC Quarterly Banking Profile eleased in late November. Note: The FDIC reports the dollar value and not the total number of REOs.
The dollar value of 1-4 family residential Real Estate Owned (REOs, foreclosure houses) was up 24% YOY from $765 million in Q3 2024 to $951 million in Q3 2025. This is still historically very low, but increasing.
Fannie Mae reported the number of REOs decreased to 4,496 at the end of Q3 2025, down 4% from 4,666 at the end of the previous quarter, and down 31% year-over-year from 6,481 in Q3 2024. Here is a graph of Fannie Real Estate Owned (REO).
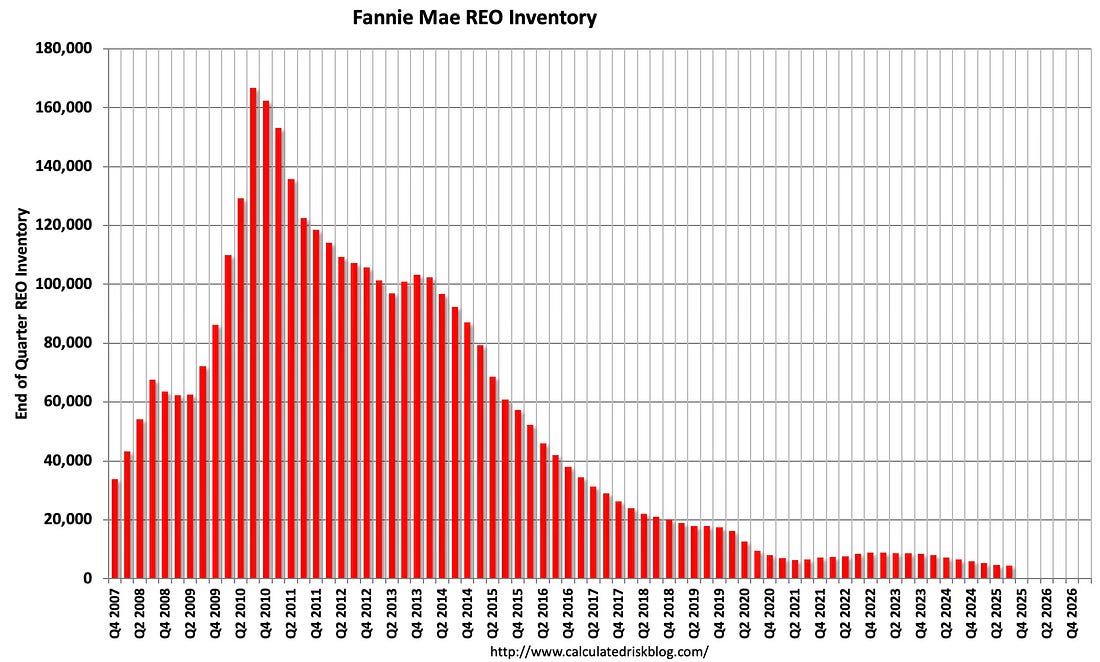
This is very low and well below the pre-pandemic levels. REOs are a lagging indicator. REOs increase when borrowers struggle financially and have little or no equity, so they can’t sell their homes – as happened after the housing bubble. That will not happen this time.