CACULATEDRISK
By Bill McBride
Earlier this week, in Part 1: Current State of the Housing Market; Overview for mid-February 2025 I reviewed home inventory, housing starts and sales.
In Part 2, I will look at house prices, mortgage rates, rents and more.
These “Current State” summaries show us where we came from, where we are, and hopefully give us clues as to where we are going!
House Prices
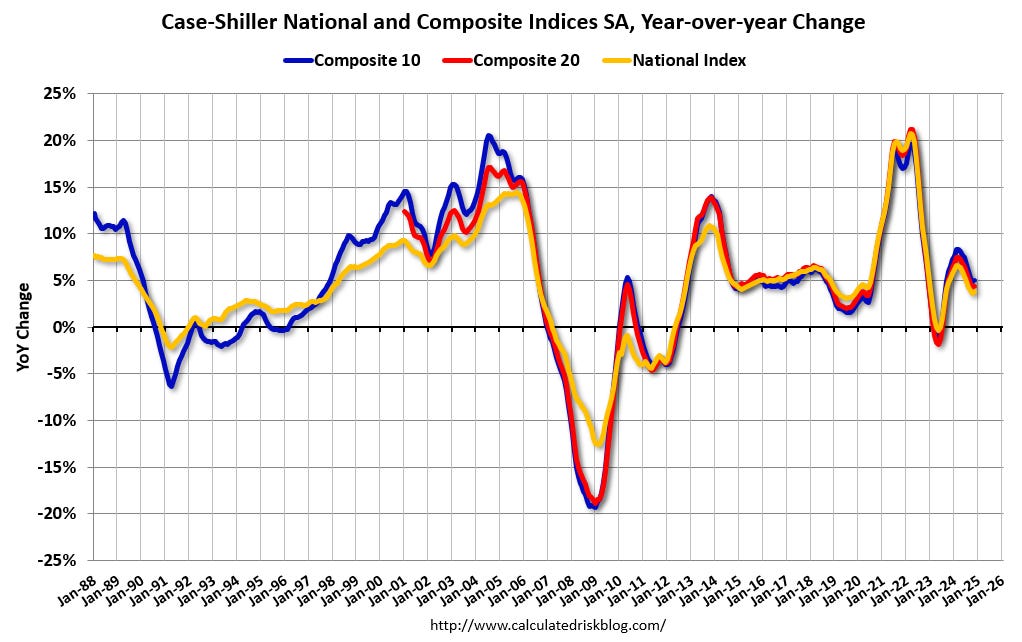
The Case-Shiller National Index increased 3.8% year-over-year (YoY) in November and will be about the same YoY – or slightly higher – in the December report (based on other data).
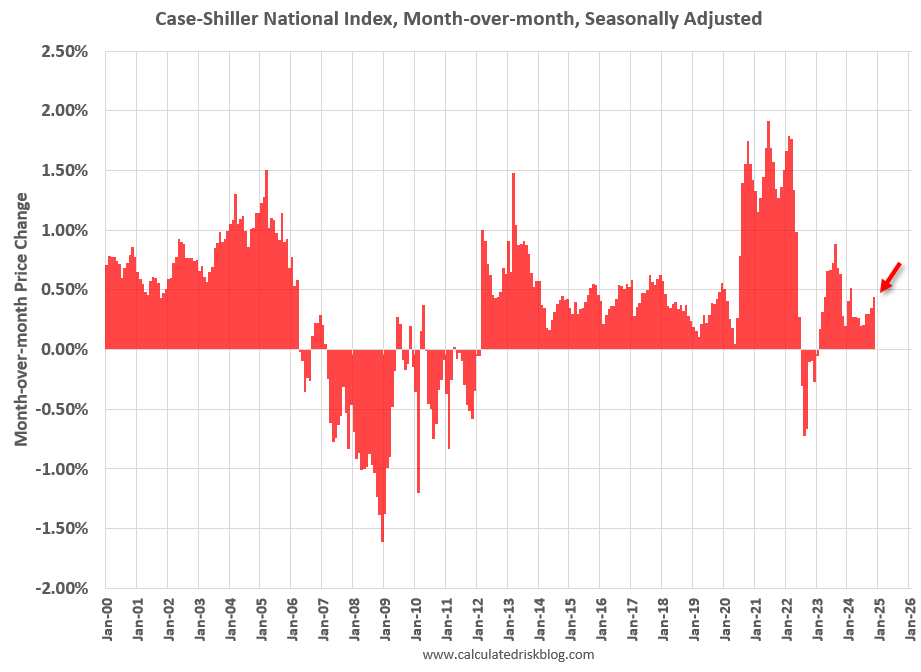
The MoM increase in the seasonally adjusted (SA) Case-Shiller National Index was at 0.44% (a 5.3% annual rate), This was the 22nd consecutive MoM increase in the seasonally adjusted index.
In Question #9 for 2025: What will happen with house prices in 2025? I discussed my outlook for house prices in 2025. A review …
In question #9 I wrote:
I don’t expect national inventory to reach 2019 levels but much of the remaining gap between 2019 and 2024 levels will likely close in 2025. If existing home sales remain fairly sluggish, we might see national months-of-supply above 5 months in mid-2025.
That would likely lead to mostly flat prices nationally in 2025. However, I expect some areas – with higher months-of-supply – will see price decline in 2025.
As I noted in Part 1, inventory is increasing year-over-year, but is still below pre-pandemic levels, however months-of-supply is higher than the last 5 years (2019 – 2023) and 2017, and close to 2018 levels. I expect the YoY price increases to continue to slow heading into 2025, although that depends on changes in inventory. I don’t expect either a crash in prices or a surge in prices.
Other measures of house prices suggest prices will be up about the same – or maybe a little higher – YoY in the December Case-Shiller index as in the November report. The NAR reported median prices were up 6.0% YoY in December, up from 4.3% YoY in November (median prices are impacted by the mix).
ICE reported prices were up 3.4% YoY in December, and Freddie Mac reported house prices were up 4.0% YoY in December, up from 3.9% YoY in November.
Here is a comparison of year-over-year change in the FMHPI, median house prices from the NAR, and the Case-Shiller National index.
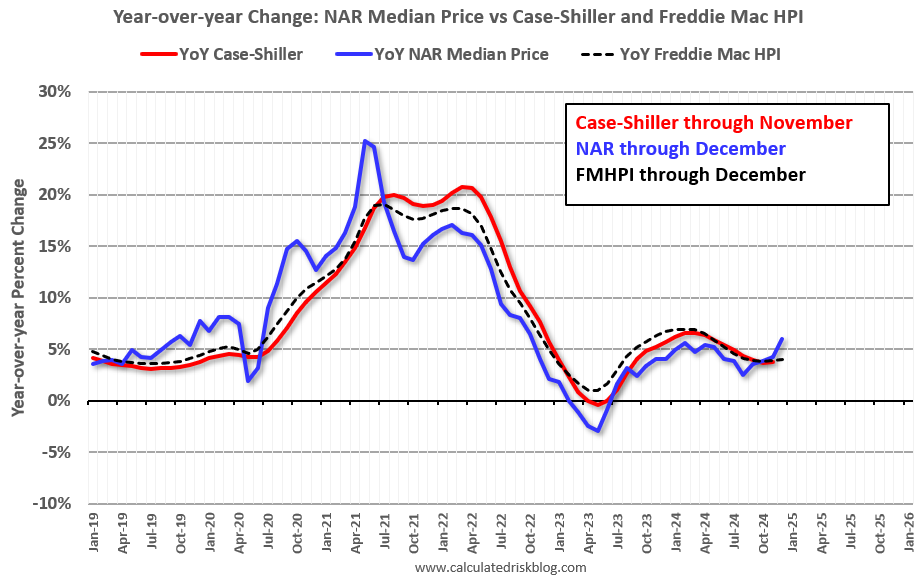
The FMHPI and the NAR median prices appear to be leading indicators for Case-Shiller. Based on recent monthly data, and the FMHPI, the YoY change in the Case-Shiller index will likely be about the same YoY – or slightly higher – in December as in November.
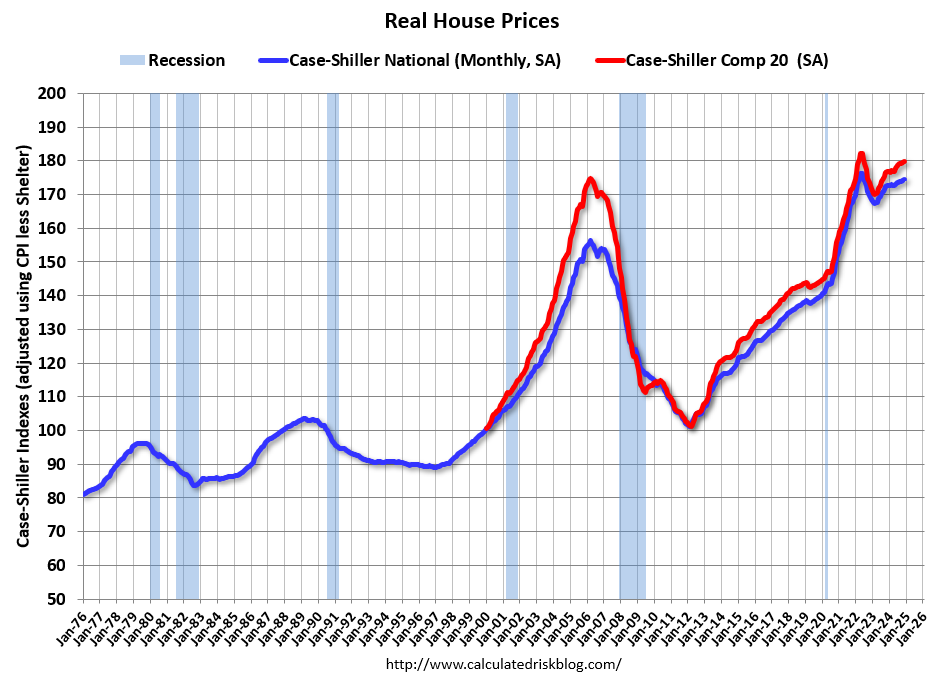
In real terms, the Case-Shiller National index is down 1.1% from the peak, seasonally adjusted. It has now been 30 months since the real peak in house prices. Typically, after a sharp increase in prices, it takes a number of years for real prices to reach new highs. There is nothing magic about “7 years”, it just made a good post title!
30-Year Mortgage Rates are Above 7%
The following graph from MortgageNewsDaily.com shows mortgage rates since January 1, 2010. 30-year mortgage rates were at 7.04% on February 13th.
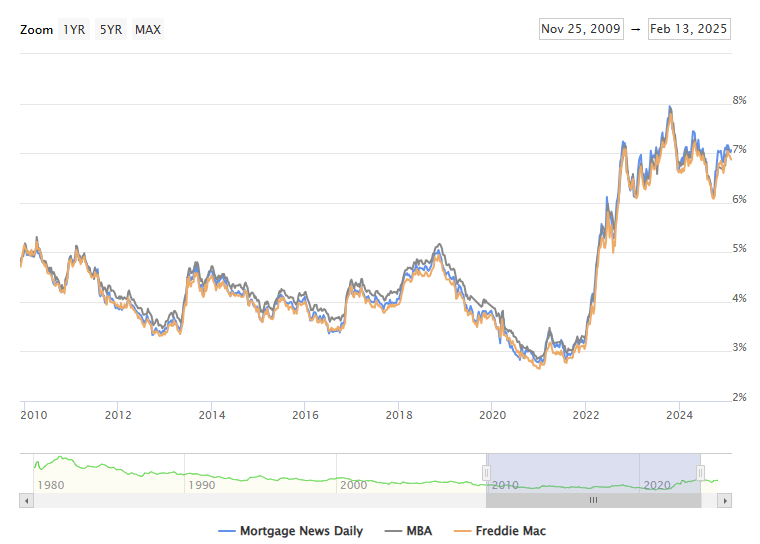
A year ago, 30-year mortgage rates were at 7.13%, two years ago rates were at 6.54%, three years ago rates were at 4.10%, and four years ago at 2.86%.
A year ago, the payment on a $500,000 house, with a 20% down payment and 7.13% 30-year mortgage rates, would be around $2,672 for principal and interest. The monthly payment for the same house, with house prices up 3.8% YoY and mortgage rates at 7.04%, would be $2,798 – an increase of 4.7%.
However, if we compare to four years ago, there is huge difference in monthly payments. In 2021, the payment on a $500,000 house, with a 20% down payment and 2.86% 30-year mortgage rates, would be around $1,656 for principal and interest. The monthly payment for the same house, with house prices up 40% over four years and mortgage rates at 7.04%, would be $3,735 – an increase of 125%!
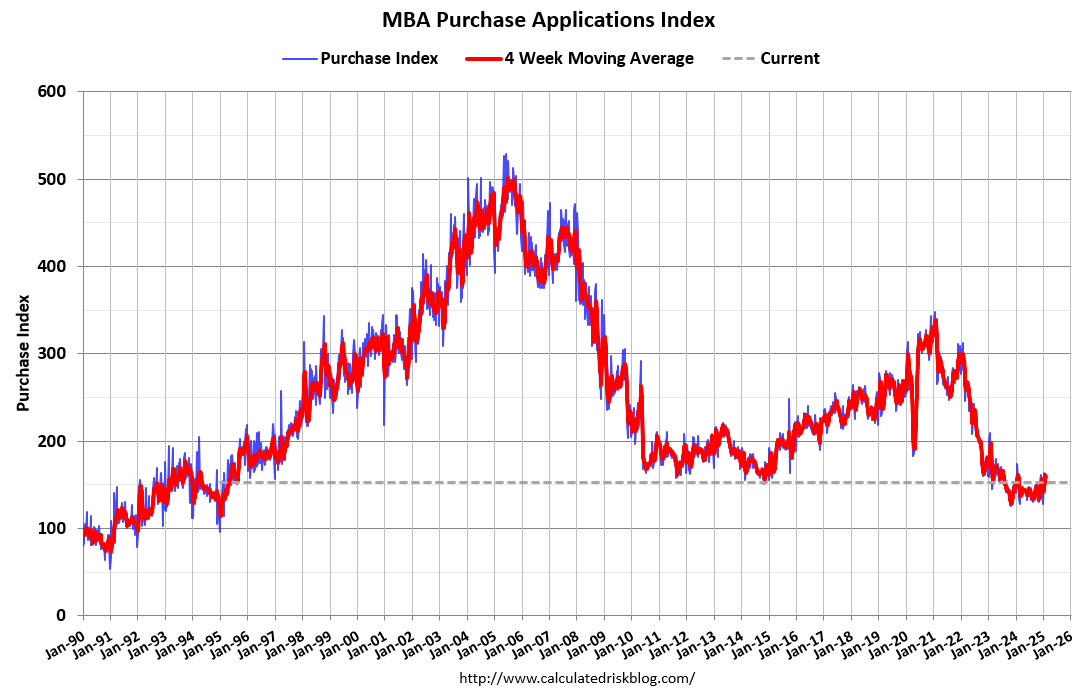
Mortgage Purchase Applications Have Increased Slightly
Here is a graph showing the MBA mortgage purchase index released Wednesday. Purchase application activity is up about 22% from the lows in late October 2023 and is now 1% above the lowest levels during the housing bust.
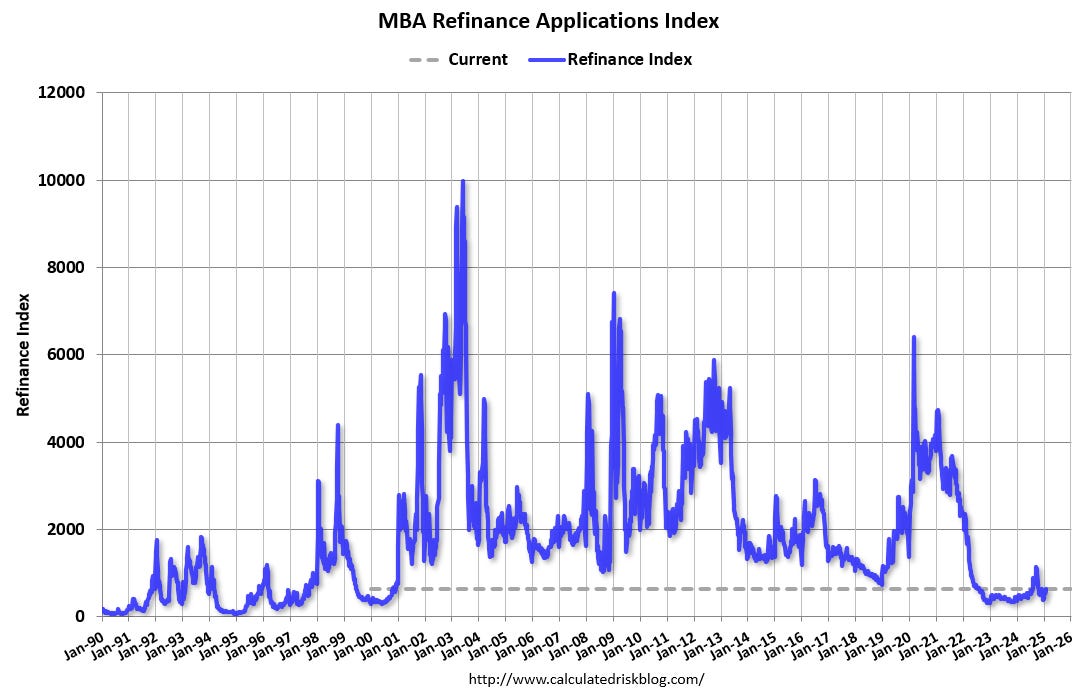
And the next graph shows the refinance index since 1990. Refinance activity increased when mortgage rates declined in September as anyone with a mortgage rate in the high 6% range or above considered refinancing their mortgage. However, as rates have increased recently, refinance activity has slowed again.
Asking Rents Mostly Unchanged Year-over-year
Here is a graph of the year-over-year (YoY) change for these measures since January 2015. Most of these measures are through December 2024, except CoreLogic is through November and Apartment List through January 2025.
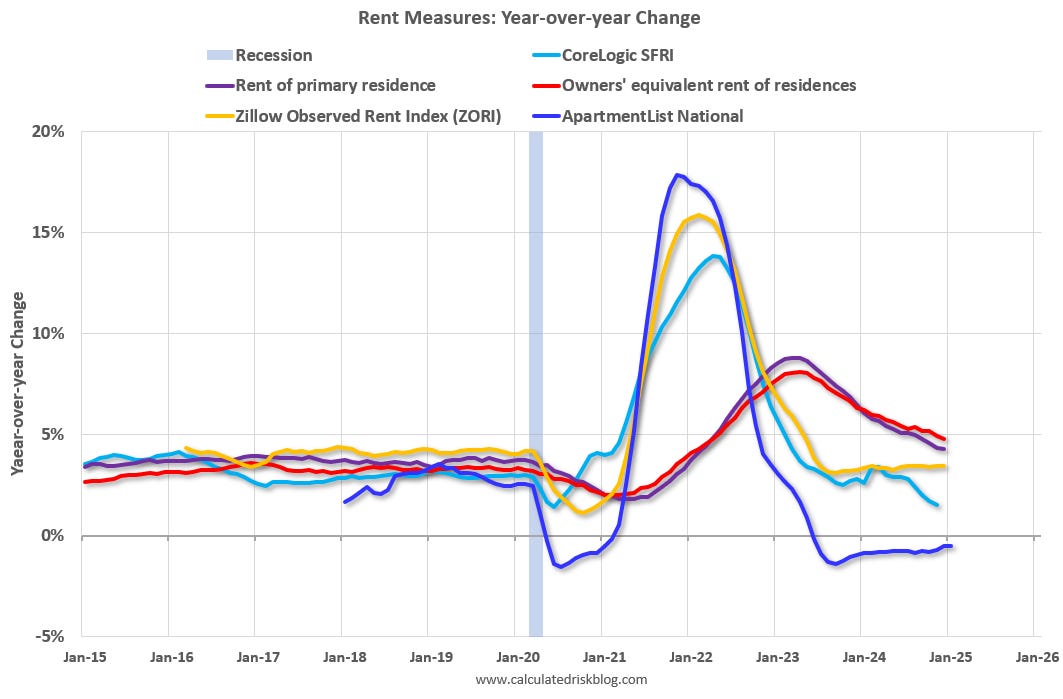
Asking rents are mostly unchanged YoY for multi-family (single family rents are up slightly), and with new supply coming on the market, we will likely see further softness in asking rents.
However, the official measures are still catching up to the private data.
Last month, I wrote Q3 Update: Delinquencies, Foreclosures and REO.
Low Levels of Delinquencies, Foreclosures and Real Estate Owned
In December, I wrote Q3 Update: Delinquencies, Foreclosures and REO. In that article I noted that with substantial equity, and low mortgage rates (mostly at a fixed rates), few homeowners will have financial difficulties during this cycle (Q4 update coming in March).
Here is a graph of the current loan-to-value (LTV) of all outstanding mortgage loans from the FHFA’s National Mortgage Database through Q3 2024 showing most borrowers have substantial equity.
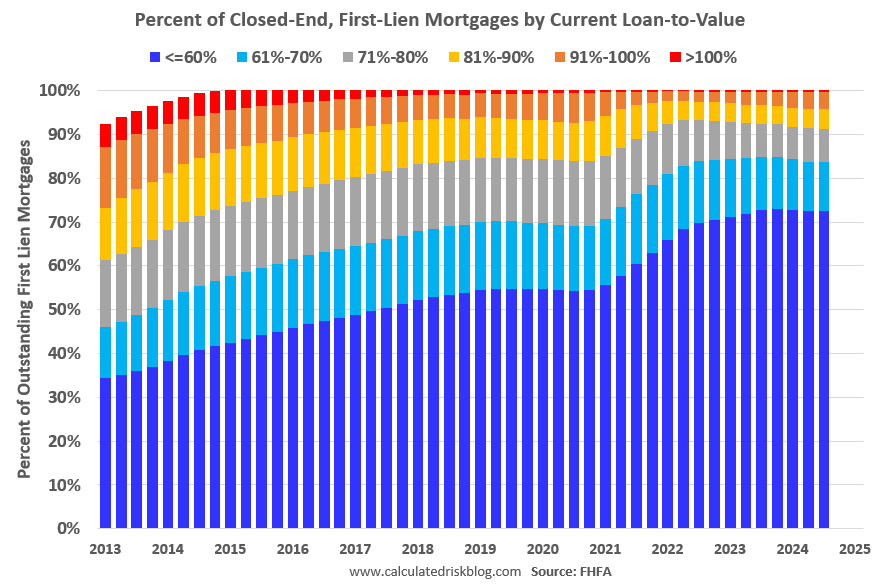
Almost 73% of borrowers have current LTVs under 60% (and this doesn’t include all the homes without a mortgage). And 91.2% of borrowers have LTVs under 80%. This is very different than during the housing bubble and bust, when a large percentage of borrowers had little or no equity.