CALCULATEDRISK
By Bill McBride
“If you do not know where you come from, then you don’t know where you are, and if you don’t know where you are, then you don’t know where you’re going. And if you don’t know where you’re going, you’re probably going wrong.” Terry Pratchett
These “Current State” summaries show us where we came from, where we are, and hopefully give us clues as to where we are going!
Yesterday, in Part 1: Current State of the Housing Market; Overview for mid-January 2024 I reviewed home inventory and sales.
House Prices
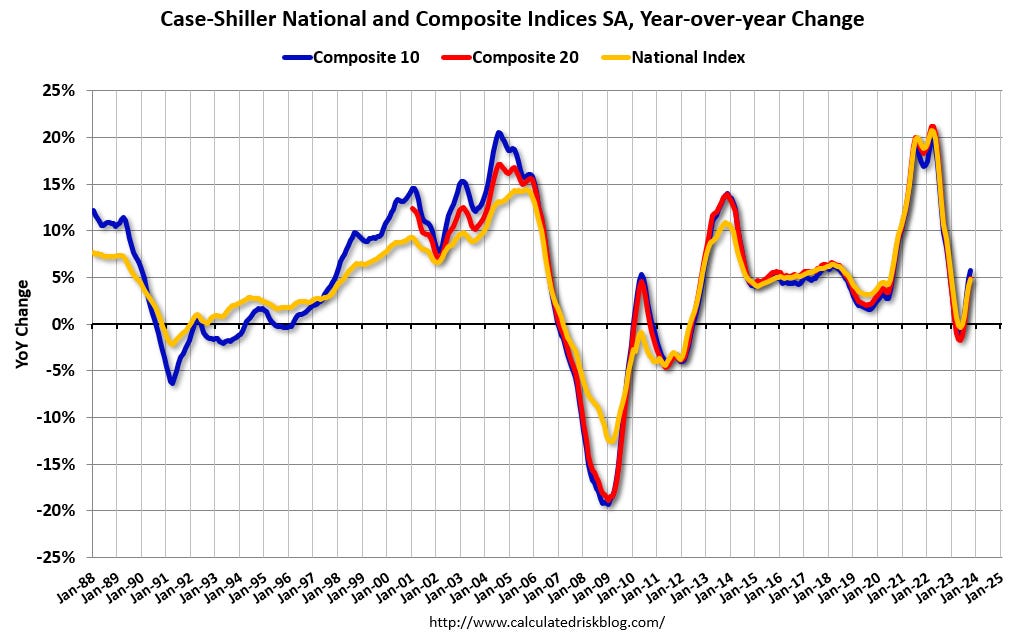
The Case-Shiller National Index increased 4.8% year-over-year in October and will likely be even more positive YoY in November (based on other data).
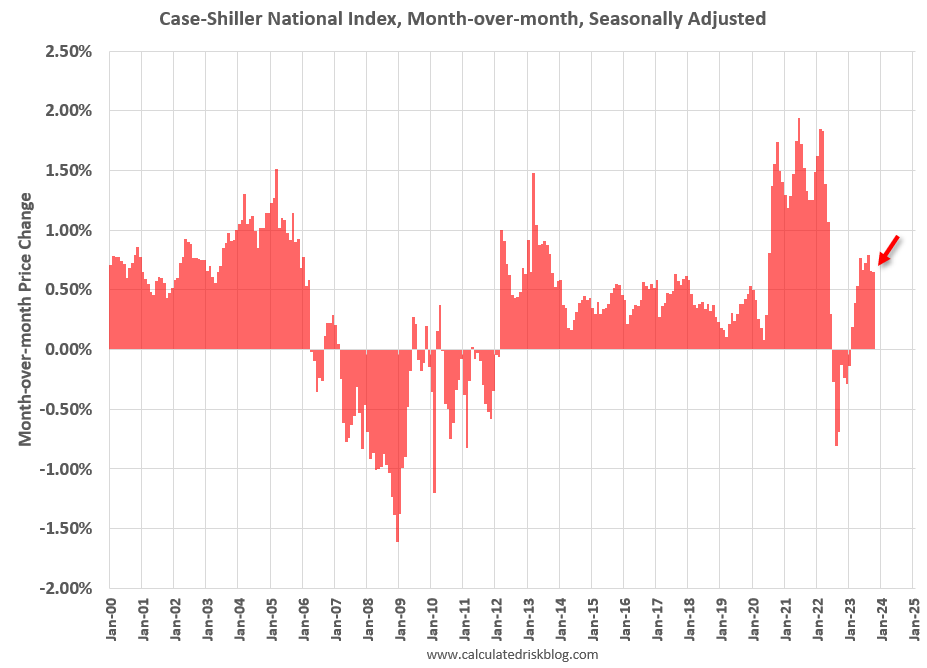
The MoM increase in the seasonally adjusted Case-Shiller National Index was at 0.65%. This was the ninth consecutive MoM increase following seven straight MoM decreases.
In a previous article: What will happen with house prices in 2024? I discussed my outlook for house prices in 2024.
Other measures of house prices suggest prices will be up further YoY in the November Case-Shiller index. The NAR reported median prices were up 4.0% YoY in November, up from 3.4% YoY in October. ICE / Black Knight reported prices were up 5.1% YoY in November, up from 4.5% YoY in October to new all-time highs, and Freddie Mac reported house prices were up 6.3% YoY in November, up from 5.6% YoY in October – and also to new all-time highs.
Here is a comparison of year-over-year change in the FMHPI, median house prices from the NAR, and the Case-Shiller National index.
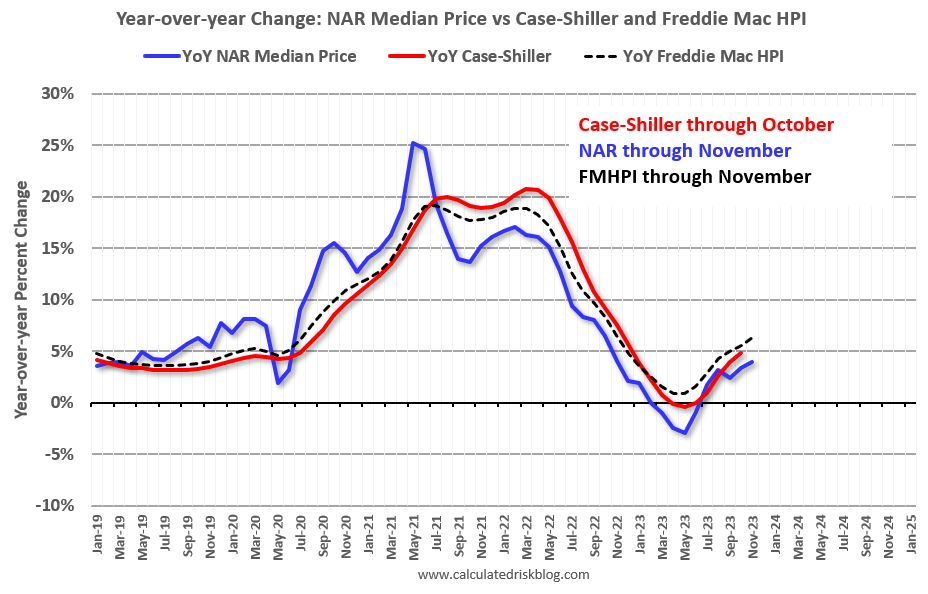
The FMHPI and the NAR median prices appear to be leading indicators for Case-Shiller. Based on recent monthly data, and the FMHPI, the YoY change in the Case-Shiller index will increase further in the report for November.
In real terms, the Case-Shiller National index is down 2.4% from the peak, seasonally adjusted. Historically it takes a number of years for real prices to return to the previous peak.
30-Year Mortgage Rates Have Declined, but Remain Well Above 6%
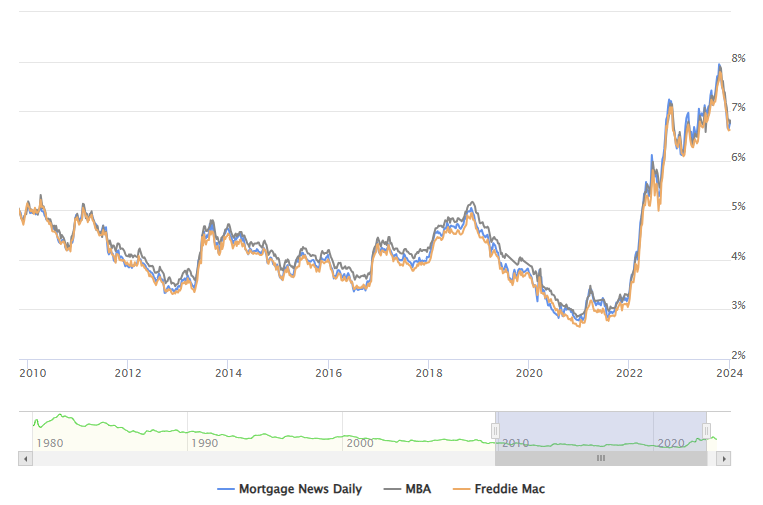
The following graph from MortgageNewsDaily.com shows mortgage rates since January 1, 2010. 30-year mortgage rates were at 6.78% on January 10th, down from just over 8% on October 19th – the highest 30-year fixed rate in 23 years. A year ago, 30-year mortgage rates were at 6.21%, and two years ago rates were at 3.64%, and three years ago rates were at 2.88%.
A year ago, the payment on a $500,000 house, with a 20% down payment and 6.21% 30-year mortgage rates, would be around $2,452 for principal and interest. The monthly payment for the same house, with house prices up 4.8% YoY and mortgage rates at 6.78%, would be $2,727 – an increase of 11%.
However, if we compare to two years ago, there is huge difference in monthly payments. In January 2022, the payment on a $500,000 house, with a 20% down payment and 3.64% 30-year mortgage rates, would be around $1,828 for principal and interest. The monthly payment for the same house, with house prices up 14.4% over two years and mortgage rates at 6.78%, would be $2,978 – an increase of 63%!
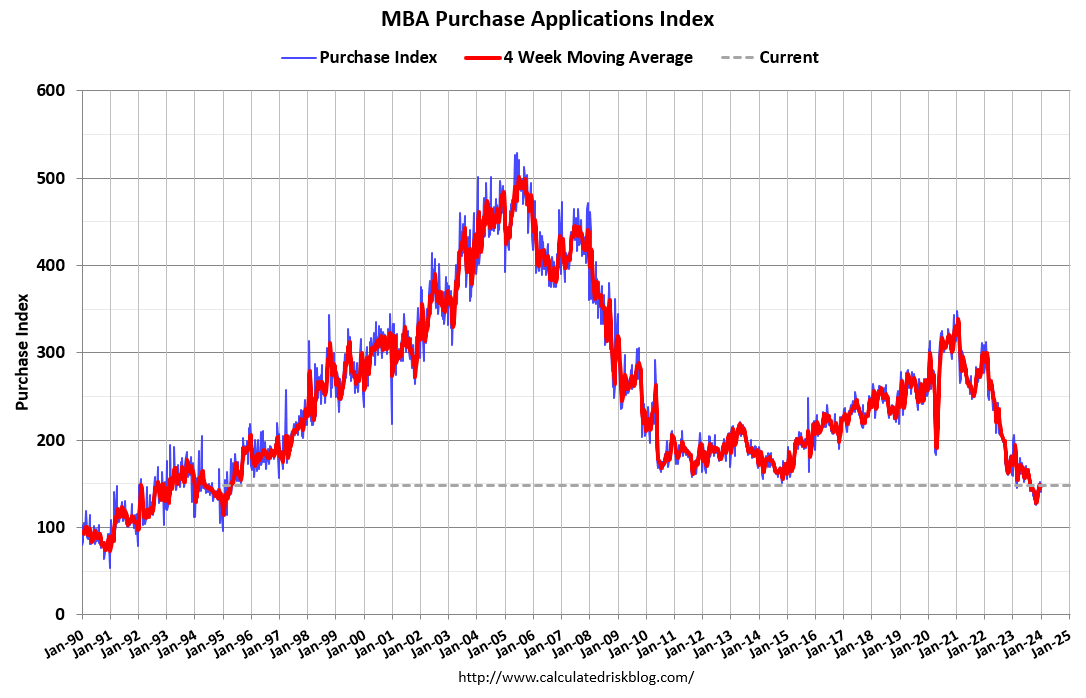
The decline in mortgage rates has led to a small pickup in mortgage application activity. Here is a graph showing the MBA mortgage purchase index released this morning. Purchase application activity is up from the lows in late October and early November, but still below the lowest levels during the housing bust.
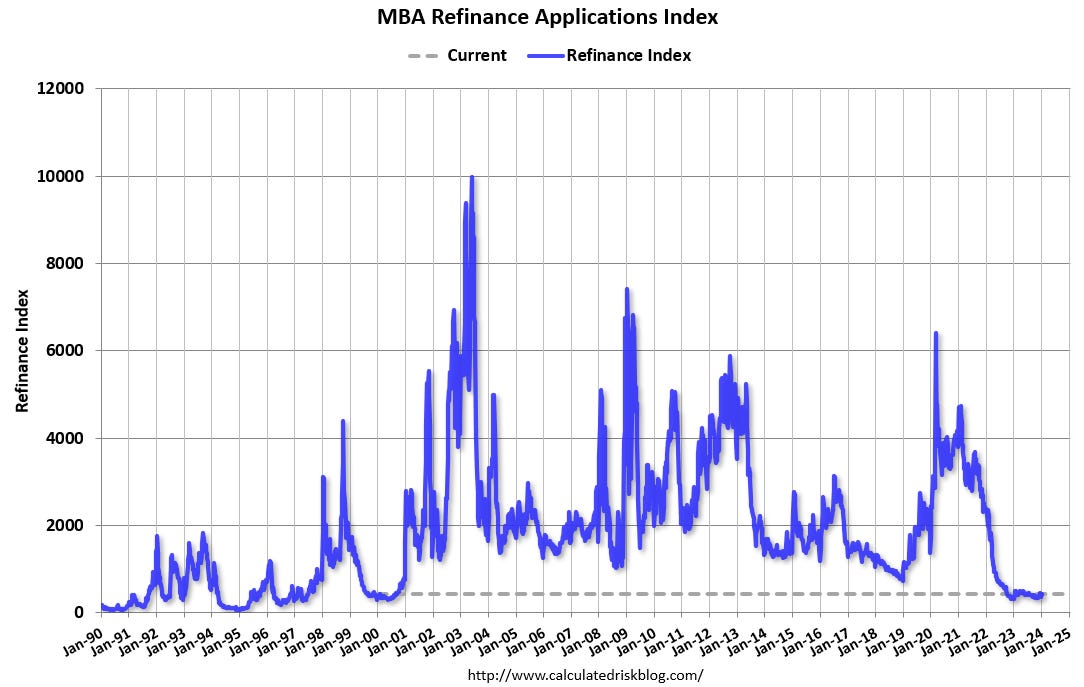
And the next graph shows the refinance index since 1990. Refinance activity has increased recently, but you have to squint to see the increase!
Asking Rents Mostly Unchanged Year-over-year
Here is a graph of the year-over-year (YoY) change for several rent measures since January 2015. Most of these measures are through November 2023, except CoreLogic is through October and Apartment List is through December 2023.
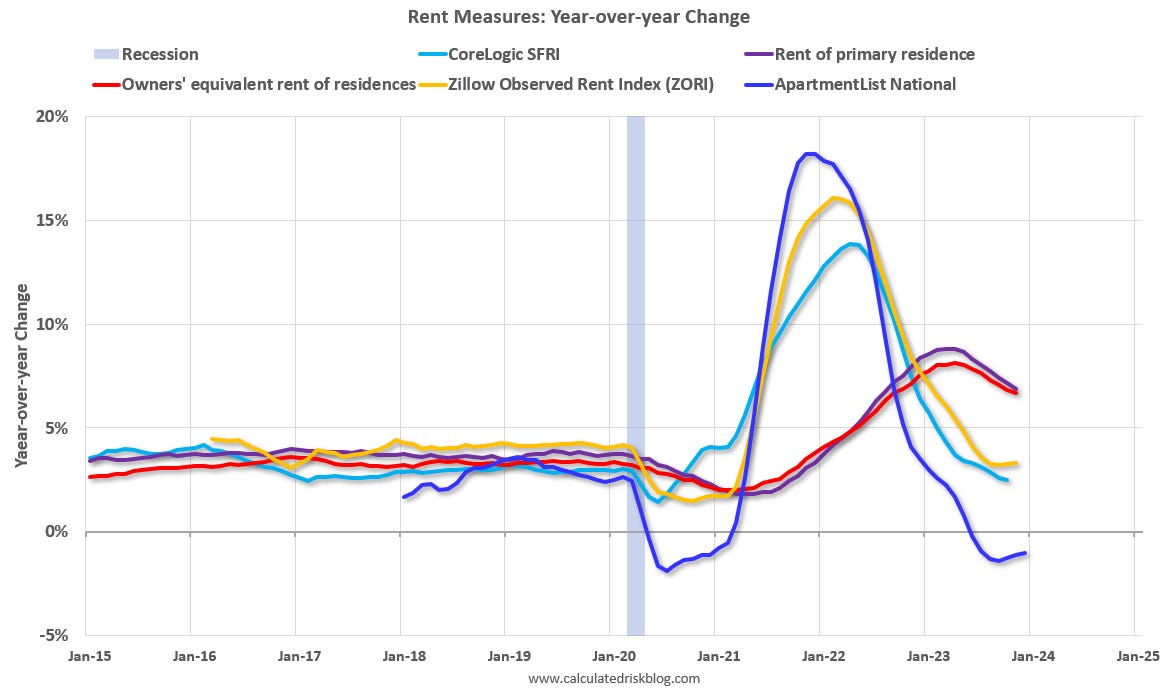
Asking rents are mostly unchanged YoY, and with new supply coming on the market, we will likely see further softness in asking rents. Moody’s just reported that effective rents were down YoY: “At the national level, asking rent was down to $1,825 while effective rent closed at $1,732, 0.8% and 1.7% lower than their respective year-ago levels.”
However, the official measures are still catching up to the private data. This morning, the BLS noted in the CPI report: “The index for shelter continued to rise in December, contributing over half of the monthly all items increase.”
This is important for housing and also for monetary policy.
Low Levels of Delinquencies, Foreclosures and Real Estate Owned
Last month, I wrote Q3 Update: Delinquencies, Foreclosures and REO. In that article I noted that with substantial equity, and low mortgage rates (mostly at a fixed rates), few homeowners will have financial difficulties during this cycle.
Here is a graph of the current loan-to-value (LTV) of all outstanding mortgage loans from the FHFA’s National Mortgage Database through Q3 2023 showing most borrowers have substantial equity.
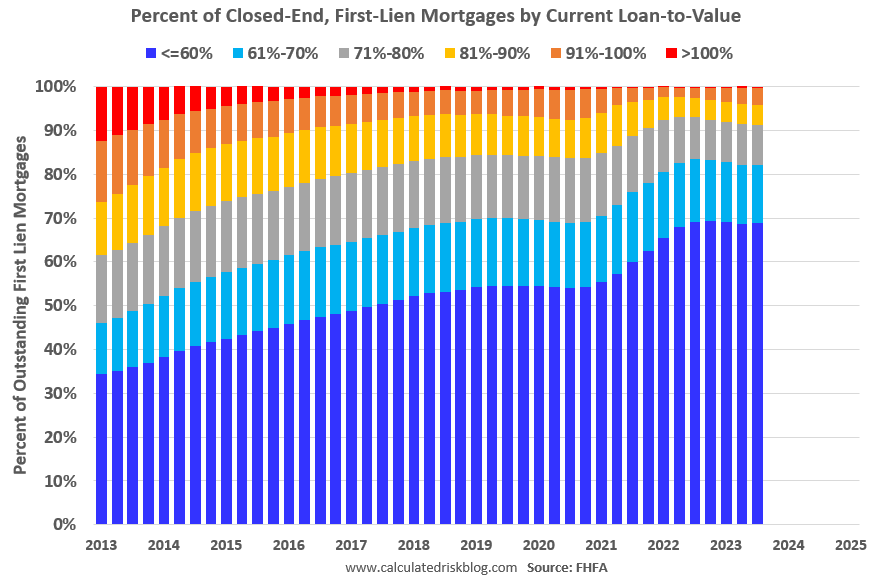
Almost 69% of borrowers have current LTVs under 60% (and this doesn’t include all the homes without a mortgage). And 91.3% of borrowers have LTVs under 80%. This is very different than during the housing bubble and bust, when a large percentage of borrowers had little or no equity.
Here is some data from the Mortgage Bankers Association’s (MBA) National Delinquency Survey.
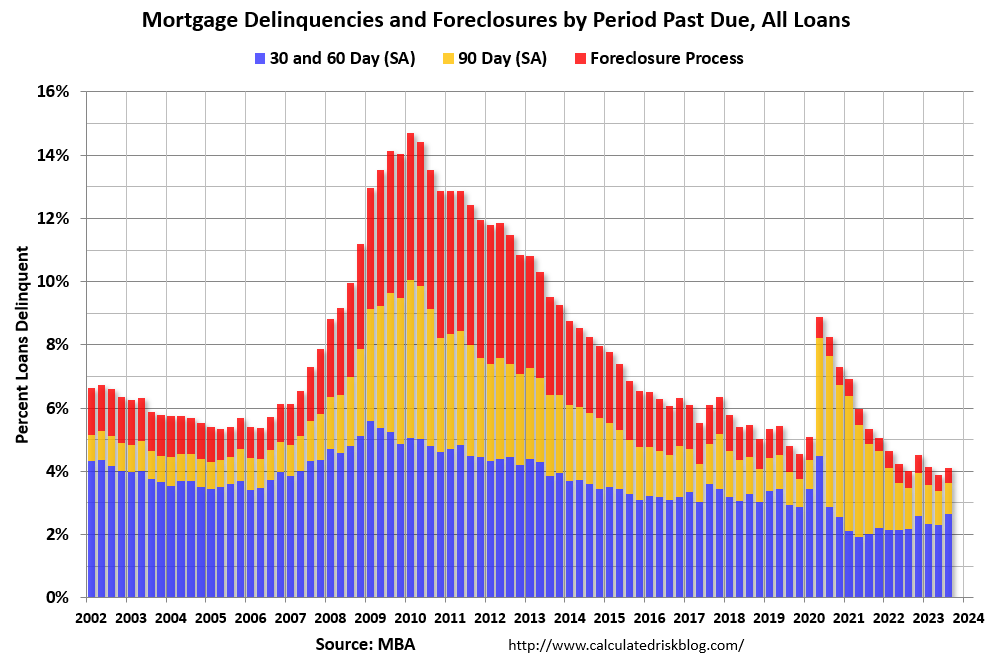
The mortgage delinquency rate increase in Q3 to a seasonally adjusted rate of 3.62 percent of all loans outstanding, up from the record low in Q2. This is historically very low.