CALCULATEDRISK
By Bill McBride
iIn Part 1: Current State of the Housing Market; Overview for mid-March 2025 I reviewed home inventory, housing starts and sales.
In Part 2, I will look at house prices, mortgage rates, rents and more.
These “Current State” summaries show us where we came from, where we are, and hopefully give us clues as to where we are going!
NOTE: I started the year taking the approach of Fed Chair Powell, a “wait and see” approach on what policies would actually be enacted. Now I’m trying to understand the impact of policy changes on housing. It appears building costs will increase significantly, and demand for housing will likely decline. I’ll have more soon.
House Prices
The Case-Shiller National Index increased 3.9% year-over-year (YoY) in December and will be about the same YoY – or slightly higher – in the January report (based on other data).
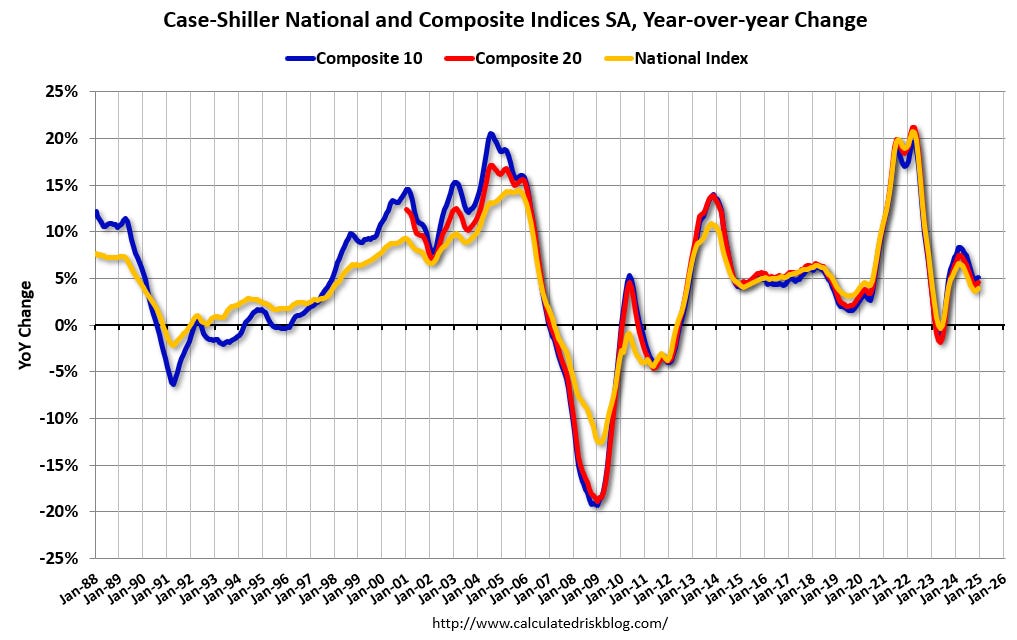
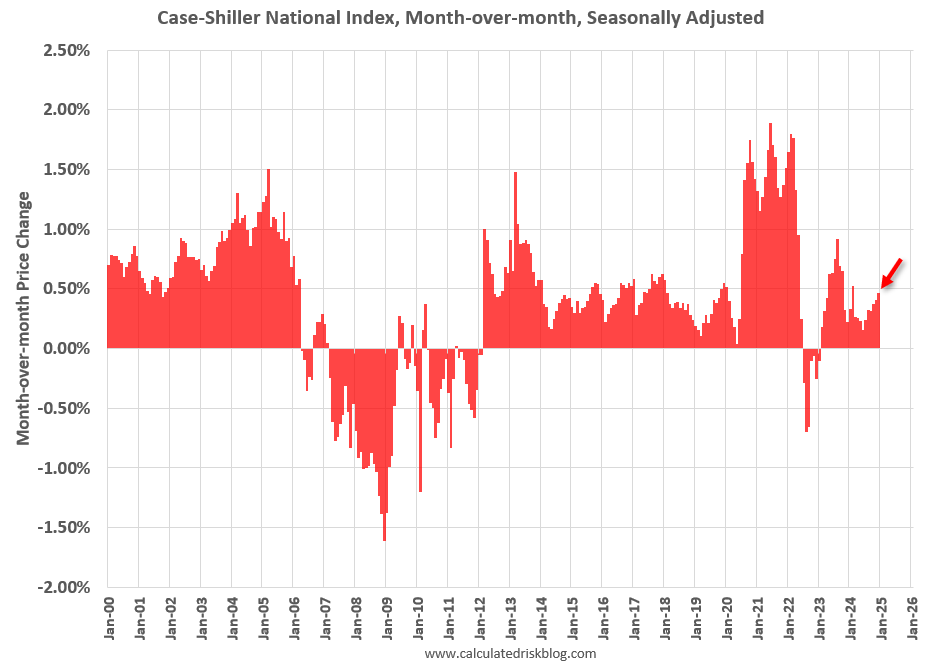
The MoM increase in the seasonally adjusted (SA) Case-Shiller National Index was at 0.46% (a 5.7% annual rate), This was the 23rd consecutive MoM increase in the seasonally adjusted index.
In Question #9 for 2025: What will happen with house prices in 2025? I discussed my outlook for house prices in 2025. A review …
In question #9 I wrote:
I don’t expect national inventory to reach 2019 levels but much of the remaining gap between 2019 and 2024 levels will likely close in 2025. If existing home sales remain fairly sluggish, we might see national months-of-supply above 5 months in mid-2025.
That would likely lead to mostly flat prices nationally in 2025. However, I expect some areas – with higher months-of-supply – will see price decline in 2025.
As I noted in Part 1, inventory is increasing year-over-year, but is still below pre-pandemic levels, however months-of-supply is higher than 6 of the last 8 years, and at the same level as in 2017. I expect the YoY price increases to continue to slow heading into 2025, although that depends on changes in inventory. I don’t expect either a crash in prices or a surge in prices.
Other measures of house prices suggest prices will be up about the same – or maybe a little higher – YoY in the January Case-Shiller index as in the December report. The NAR reported median prices were up 4.8% YoY in January, down from 5.8% YoY in December (median prices are impacted by the mix).
ICE reported prices were up 3.0% YoY in January, down from 3.4% YoY in December, and Freddie Mac reported house prices were up 3.9% YoY in January, down from 4.1% YoY in December.
Here is a comparison of year-over-year change in the FMHPI, median house prices from the NAR, and the Case-Shiller National index.
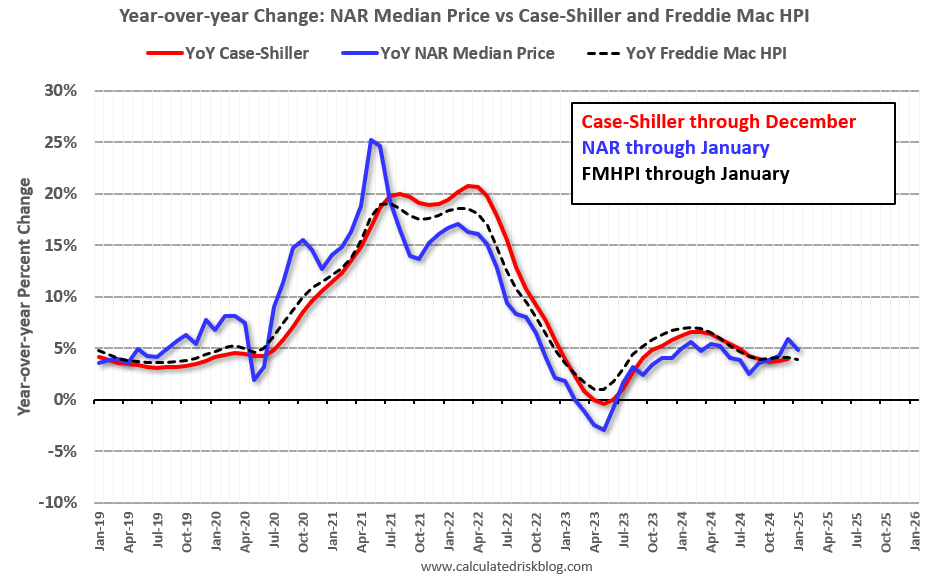
The FMHPI and the NAR median prices appear to be leading indicators for Case-Shiller. Based on recent monthly data, and the FMHPI, the YoY change in the Case-Shiller index will likely be about the same YoY – or slightly higher – in January as in December.
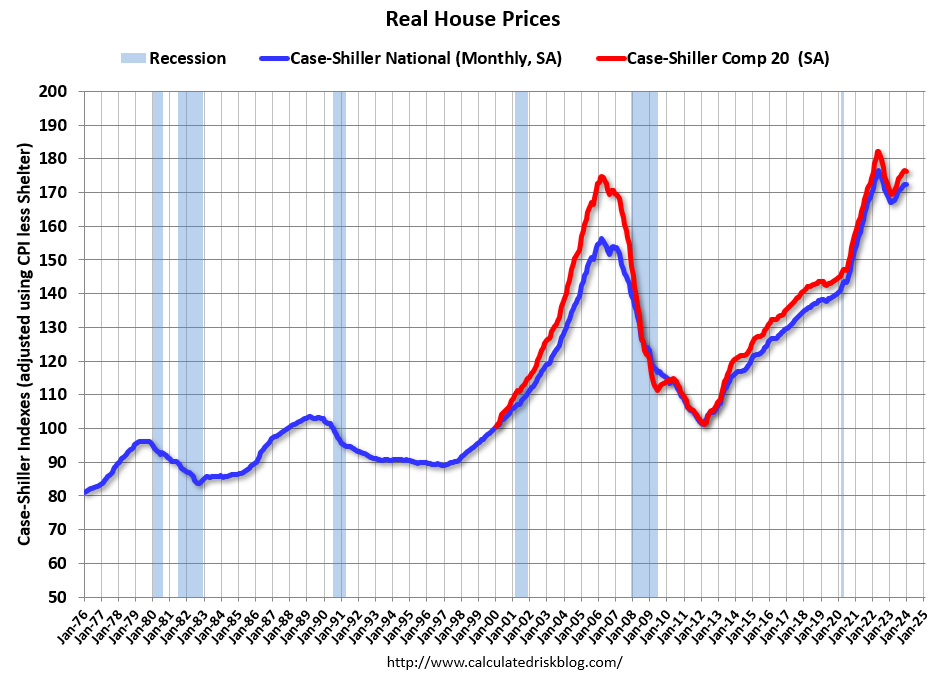
In real terms, the Case-Shiller National index is down 1.0% from the peak, seasonally adjusted. It has now been 31 months since the real peak in house prices. Typically, after a sharp increase in prices, it takes a number of years for real prices to reach new highs. There is nothing magic about “7 years”, it just made a good post title!
30-Year Mortgage Rates are Back Below 7%
The following graph from MortgageNewsDaily.com shows mortgage rates since January 1, 2010. 30-year mortgage rates were at 6.79% on March 11th. Mortgage rates will likely increase today.
30-year mortgage rates in the 6% to 7% range are the new normal.
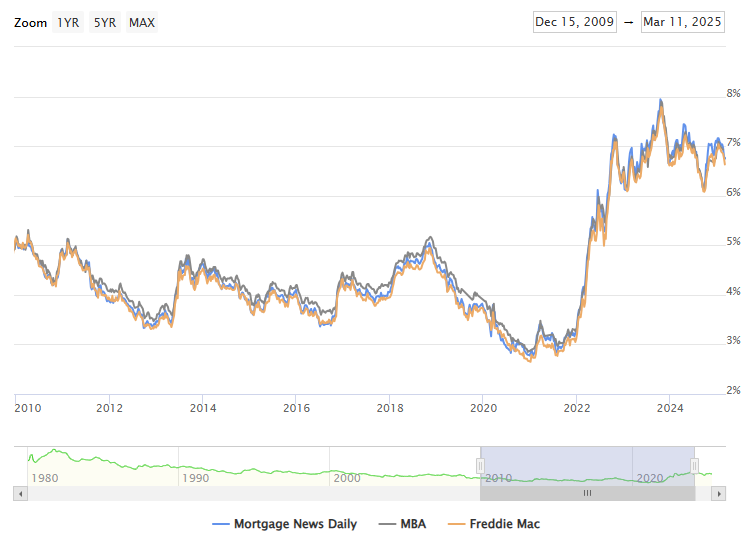
A year ago, 30-year mortgage rates were at 6.87%, two years ago rates were at 6.76%, three years ago rates were at 4.29%, and four years ago at 3.27%.
A year ago, the payment on a $500,000 house, with a 20% down payment and 6.87% 30-year mortgage rates, would be around $2,626 for principal and interest. The monthly payment for the same house, with house prices up 3.9% YoY and mortgage rates at 6.79%, would be $2,708 – an increase of 3.1%.
However, if we compare to four years ago, there is huge difference in monthly payments. In 2021, the payment on a $500,000 house, with a 20% down payment and 3.27% 30-year mortgage rates, would be around $1,745 for principal and interest. The monthly payment for the same house, with house prices up 38% over four years and mortgage rates at 6.79%, would be $3,606 – an increase of 107%!
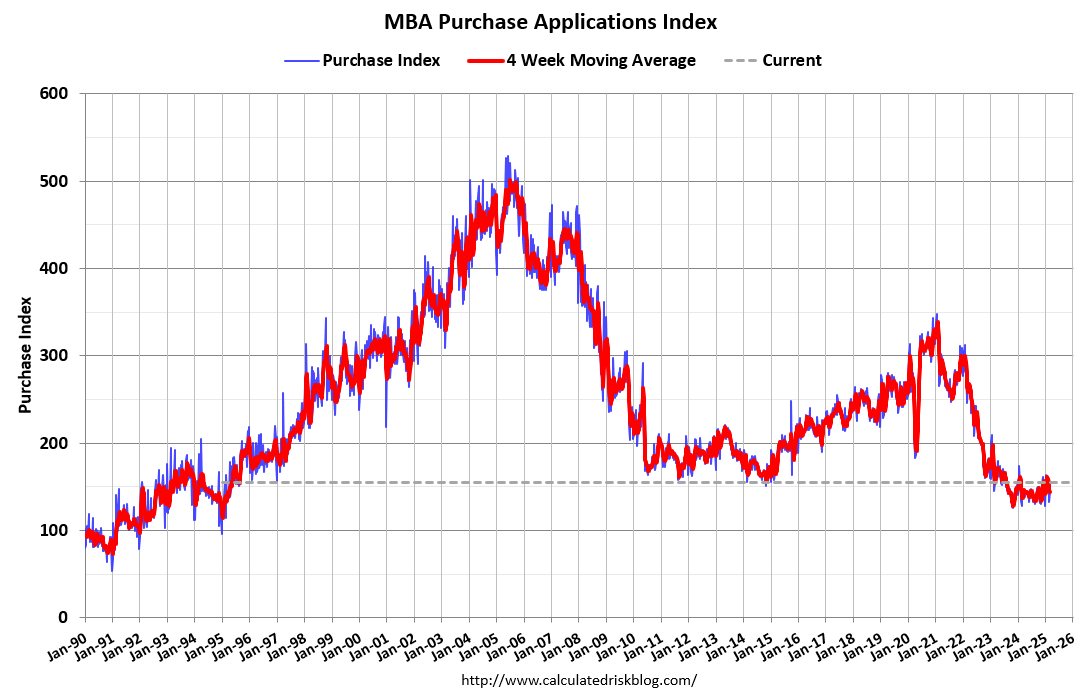
Mortgage Purchase Applications Have Increased Slightly
Here is a graph showing the MBA mortgage purchase index released today. Purchase application activity is up about 23% from the lows in late October 2023 and is only 2% above the lowest levels during the housing bust.
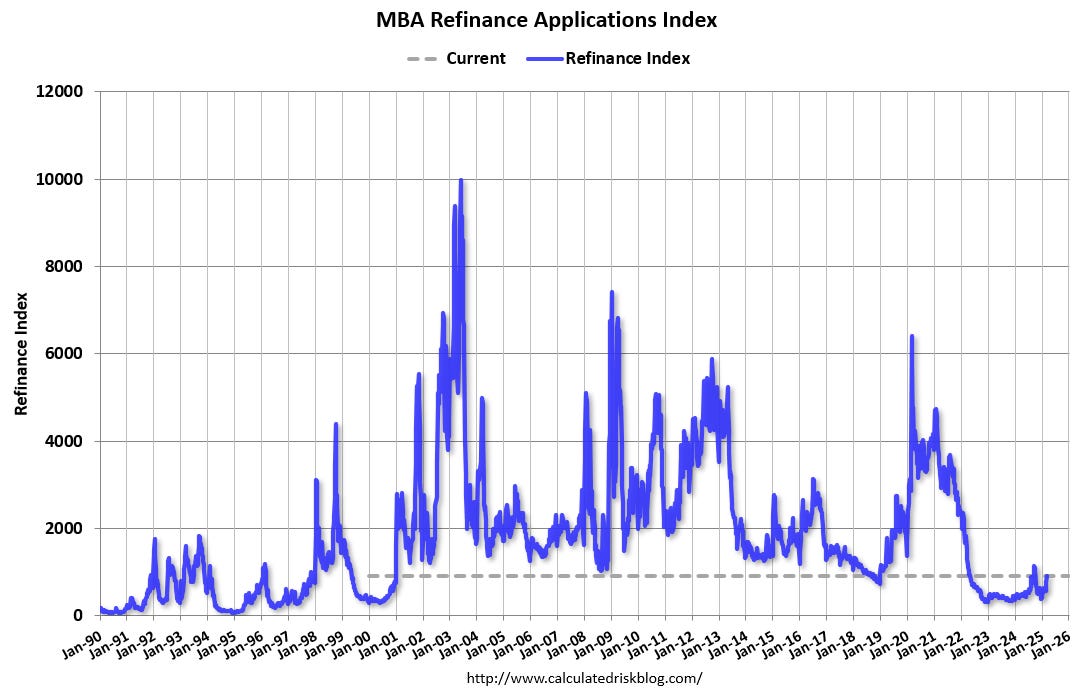
And the next graph shows the refinance index since 1990. Refinance activity increased when mortgage rates declined in September 2024 as anyone with a mortgage rate in the high 6% range or above considered refinancing their mortgage. Ss rates have decreased recently, refinance activity has increased again – but is still very low.
Asking Rents Mostly Unchanged Year-over-year
Here is a graph of the year-over-year (YoY) change for these measures since January 2015. Most of these measures are through January 2025, except CoreLogic is through December and Apartment List through February 2025.
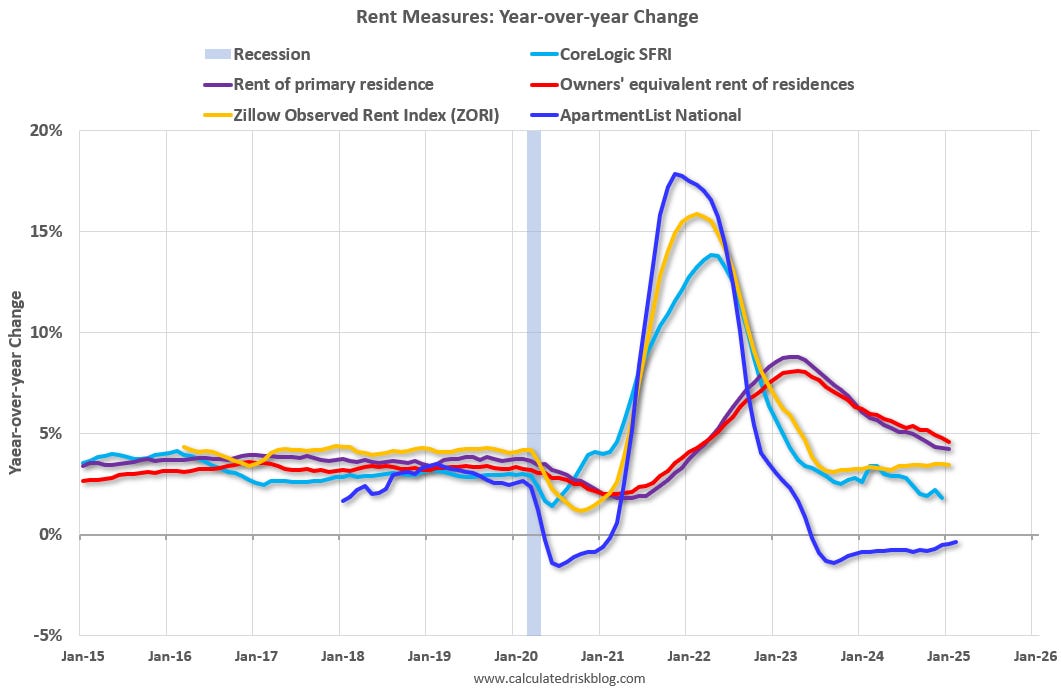
Asking rents are mostly unchanged YoY for multi-family (single family rents are up slightly), and with new supply coming on the market, we will likely see further pressure on asking rents.
However, the official measures are still catching up to the private data.
Last month, I wrote Q3 Update: Delinquencies, Foreclosures and REO.
NY Fed: Mortgage Originations by Credit Score
The NY Fed released the Q4 Quarterly Report on Household Debt and Credit last month. This graph shows mortgage originations by credit score (this includes both purchase and refinance). Look at the difference in credit scores in the recent period compared to the during the bubble years (2003 through 2006). Recently there have been almost no originations for borrowers with credit scores below 620, and few below 660. A significant majority of recent originations have been to borrowers with credit score above 760.
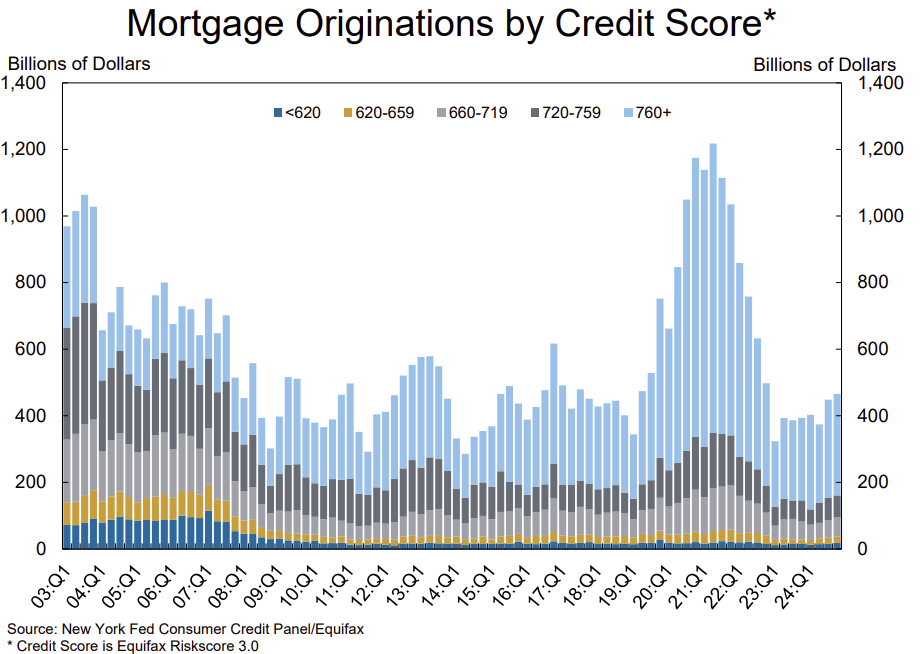
With solid underwriting, and most homeowners having substantial equity, we will not see a surge in distress sales like during the housing bust.