CALCULATEDRISK
By Bill McBride
in Part 1: Current State of the Housing Market; Overview for mid-May 2025 I reviewed home inventory, housing starts and sales. I noted that the key story right now for existing homes is that inventory is increasing sharply, and sales are essentially flat compared to last year. That means prices will be under pressure (although there will not be a huge wave of distressed sales). And there are significant regional differences too.
In Part 2, I will look at house prices, mortgage rates, rents and more.
These “Current State” summaries show us where we came from, where we are, and hopefully give us clues as to where we are going!
House Prices
The Case-Shiller National Index increased 3.9% year-over-year (YoY) in February and will likely be lower year-over-year in the March report compared to February (based on other data).

The MoM increase in the seasonally adjusted (SA) Case-Shiller National Index was at 0.26% (a 3.1% annual rate), This was the 25th consecutive MoM increase in the seasonally adjusted index.
Two months ago, I wrote Policy and 2025 Housing Outlook I updated my outlook for 2025, and for house prices I noted …
Rising months-of-supply will put pressure on prices, but my guess is that that would be more of a 2026 story since house prices then to be sticky downwards (it takes time for sellers to realize they need to lower their price). So, I’ll stick with my “mostly flat prices nationally in 2025”.
As I noted in Part 1, inventory is increasing sharply year-over-year, but is still below pre-pandemic levels, however months-of-supply is higher than the previous 8 years! And I now expect inventory to be close to 2019 levels by the end of 2025.
Other measures of house prices suggest prices will be up a little less YoY in the March Case-Shiller index as in the February report. The NAR reported median prices were up 2.4% YoY in March, down from 3.4% YoY in February (median prices are impacted by the mix).
ICE reported prices were up 2.7% YoY in March, down from 3.5% YoY in February, and Freddie Mac reported house prices were up 3.0% YoY in March, down from 3.4% YoY in February.
Here is a comparison of year-over-year change in the FMHPI, median house prices from the NAR, and the Case-Shiller National index.
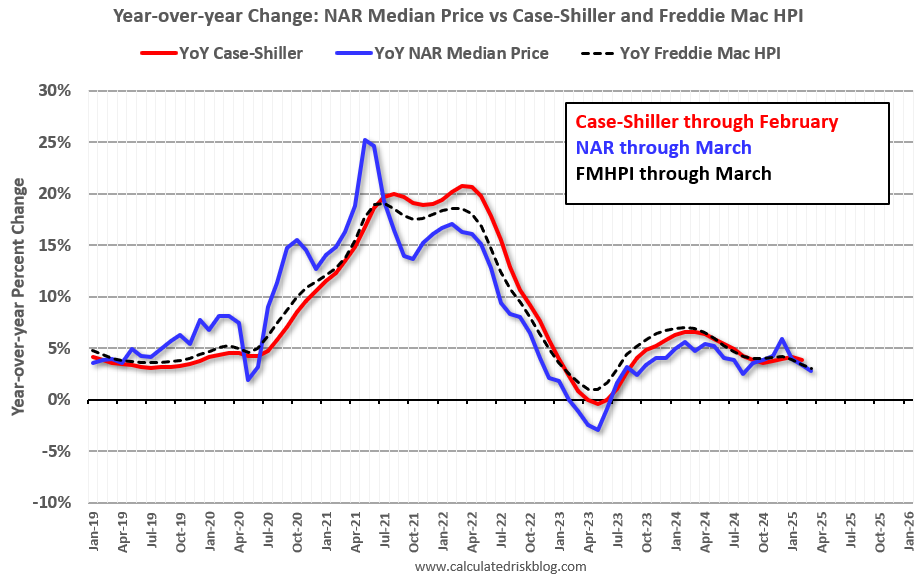
The FMHPI and the NAR median prices appear to be leading indicators for Case-Shiller. Based on recent monthly data, and the FMHPI, the YoY change in the Case-Shiller index will likely be lower in March as in February.
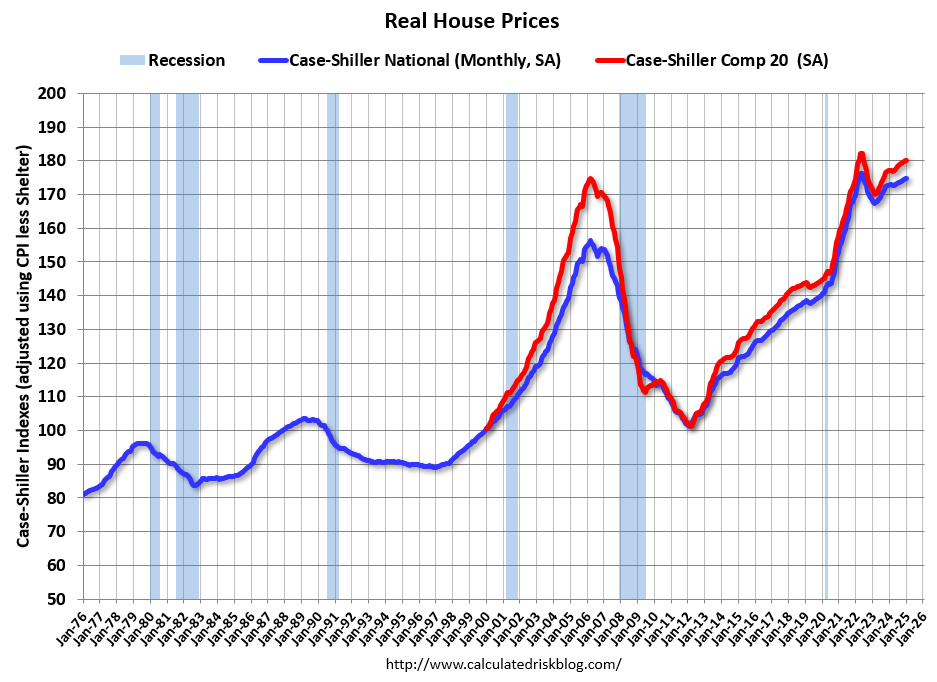
In real terms, the Case-Shiller National index is down 0.8% from the peak, seasonally adjusted. It has now been 32 months since the real peak in house prices. Typically, after a sharp increase in prices, it takes a number of years for real prices to reach new highs. There is nothing magic about “7 years”, it just made a good post title!
30-Year Mortgage Rates just under 7%
The following graph from MortgageNewsDaily.com shows mortgage rates since January 1, 2010. 30-year mortgage rates were at 6.95% on May 14th.
30-year mortgage rates in the 6% to 7% range are the new normal.
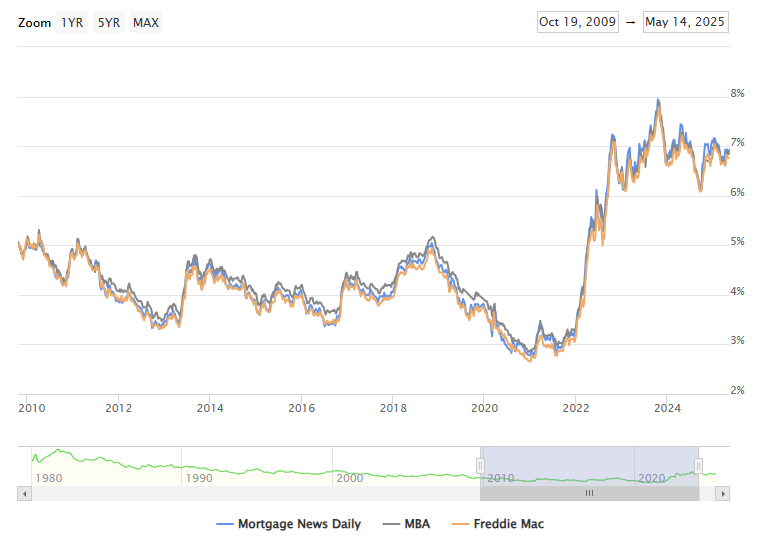
A year ago, 30-year mortgage rates were at 7.11%, two years ago rates were at 6.67%, three years ago rates were at 5.37%, and four years ago at 3.14%.
It is financially very difficult for homeowners to move and give up their 3% mortgage rates, however time and life changes are slowing leading to more listings.
Mortgage Purchase Applications Have Increased Recently
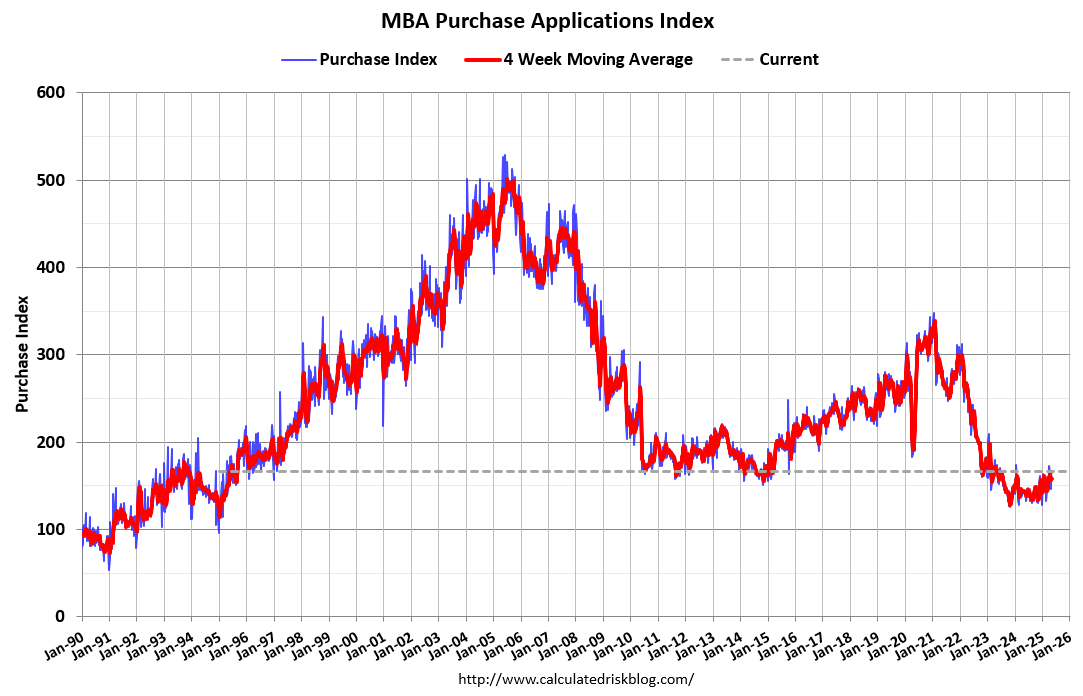
Here is a graph showing the MBA mortgage purchase index released today. Purchase application activity is up from the lows in late October 2023 and is 10% above the lowest levels during the housing bust.
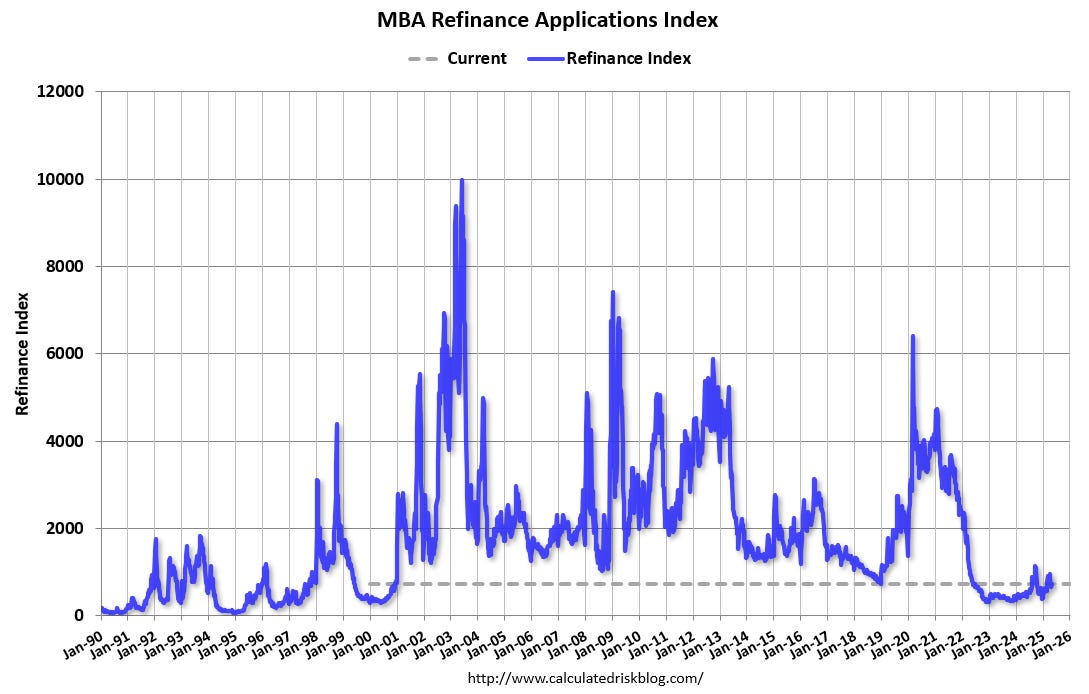
And the next graph shows the refinance index since 1990. Refinance activity is still very low.
Asking Rents Mostly Unchanged Year-over-year
Here is a graph of the year-over-year (YoY) change for these measures since January 2015. Most of these measures are through March 2025, except Apartment List through April 2025.
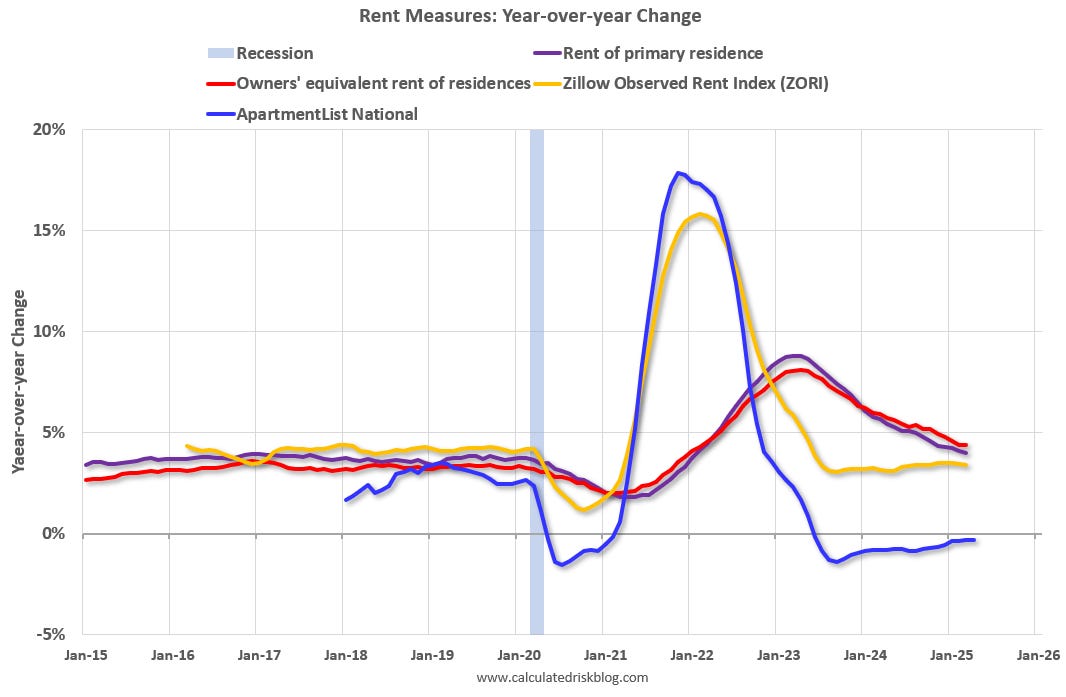
Asking rents are mostly unchanged YoY for multi-family and with new supply coming on the market, we will likely see continued pressure on asking rents.
Delinquencies and Foreclosures increasing Slightly
Here is a graph from the MBA’s National Delinquency Survey through Q1 2025.
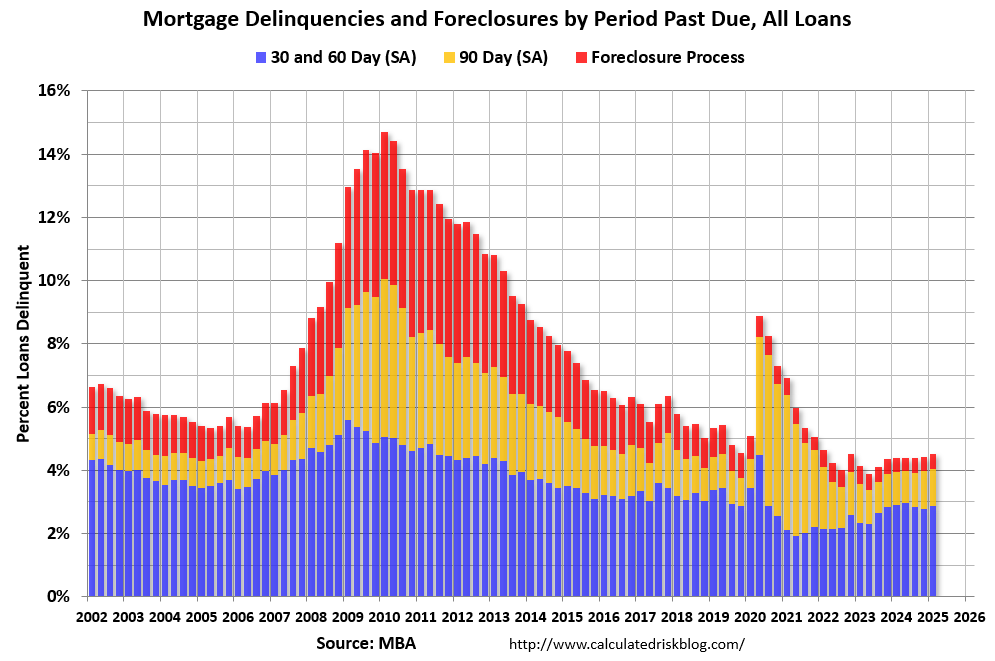
The percent of loans in the foreclosure process increased year-over-year from 0.46 percent in Q1 2024 to 0.49 percent in Q1 2025 (red) but remains historically low (mostly due to the end of the VA moratorium).
The seasonally adjusted delinquency rate increased to 4.04 percent from 3.94 percent in Q1 2024.
Overall delinquencies and foreclosures are historically low.