CALCULATEDRISK
By Bill McBride
Part 1: Current State of the Housing Market; Overview for mid-October 2024 I reviewed home inventory, housing starts and sales.
In Part 2, I will look at house prices, mortgage rates, rents and more.
“If you do not know where you come from, then you don’t know where you are, and if you don’t know where you are, then you don’t know where you’re going. And if you don’t know where you’re going, you’re probably going wrong.” Terry Pratchett
These “Current State” summaries show us where we came from, where we are, and hopefully give us clues as to where we are going!
House Prices
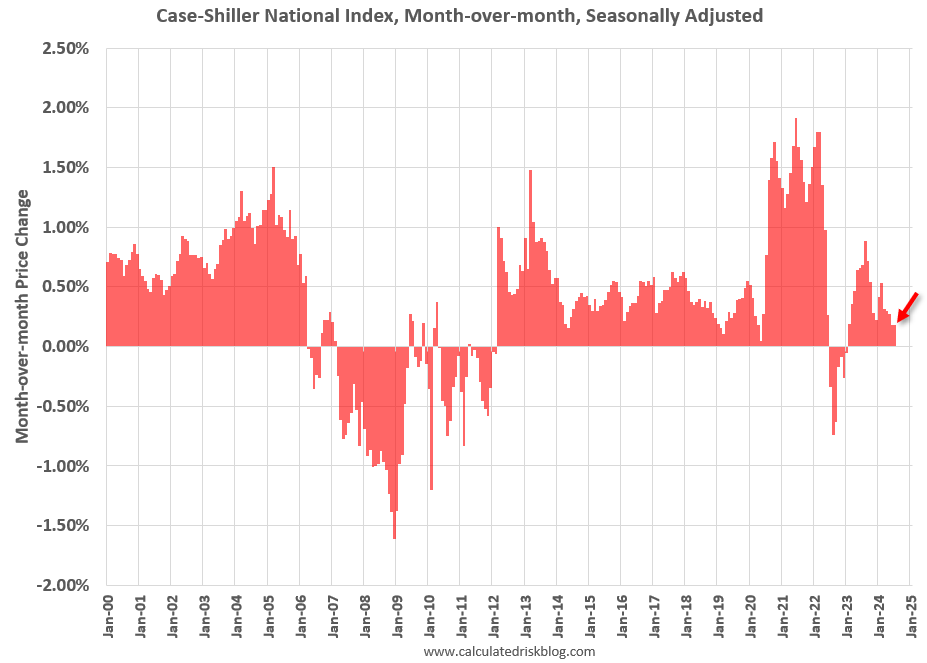
The Case-Shiller National Index increased 5.0% year-over-year in July and will likely slow further in the August report (based on other data).

For the second consecutive month, the MoM increase in the seasonally adjusted (SA) Case-Shiller National Index was at 0.18% (a 2.2% annual rate), This was the eighteenth consecutive MoM increase, but this tied the previous as the smallest MoM increase in the last 18 months.
In Question #9 for 2024: What will happen with house prices in 2024? I discussed my outlook for house prices in 2024. A review …
In question #9 I wrote:
“I don’t expect inventory to reach 2019 levels but based on the recent increase in inventory maybe more than half the gap between 2019 and 2023 levels will close in 2024. If existing home sales remain sluggish, we could see months-of-supply back to 2017 – 2019 levels.
That would likely put price increases in the 3% to 4% range in 2024. I don’t expect either a crash in prices or a surge in prices. And as usual, we will have to watch inventory and adjust the outlook.”
As I noted in Part 1, inventory is increasing year-over-year, but is still below 2019 levels, but months-of-supply is higher than the last 5 years (2019 – 2023), and at 2017 levels. This outlook for prices still seems reasonable – I expect the YoY increase to continue to slow, although that depends on changes in inventory. I don’t expect either a crash in prices or a surge in prices.
Other measures of house prices suggest prices will be up less YoY in the August Case-Shiller index than in the July report. The NAR reported median prices were up 3.1% YoY in August, down from 3.9% YoY in July.
ICE reported prices were up 3.0% YoY in August, down from 3.6% YoY in July, and Freddie Mac reported house prices were up 3.7% YoY in August, down from 4.5% YoY in July.
Here is a comparison of year-over-year change in the FMHPI, median house prices from the NAR, and the Case-Shiller National index.

The FMHPI and the NAR median prices appear to be leading indicators for Case-Shiller. Based on recent monthly data, and the FMHPI, the YoY change in the Case-Shiller index will likely be lower YoY in August compared to July.
In real terms, the Case-Shiller National index is down 1.5% from the peak, seasonally adjusted. Historically it takes a number of years for real prices to return to the previous peak.

30-Year Mortgage Rates Have Are Over 6.5%
The following graph from MortgageNewsDaily.com shows mortgage rates since January 1, 2010. 30-year mortgage rates were at 6.64% on October 11th, up somewhat following the Fed’s rate cut.
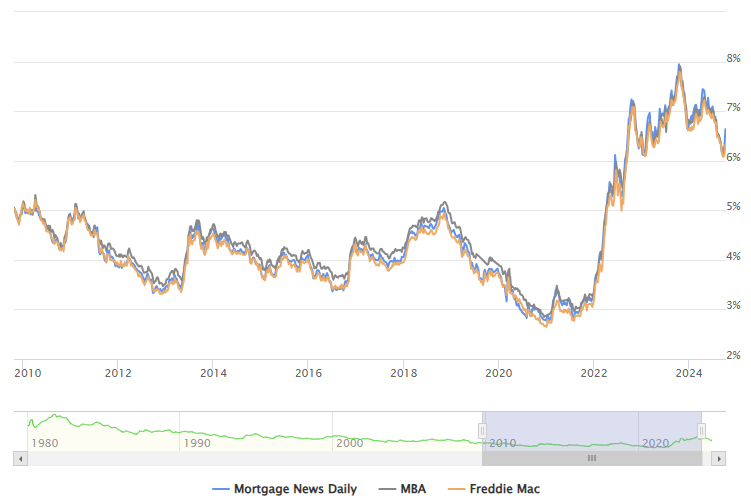
A year ago, 30-year mortgage rates were at 7.60%, two years ago rates were at 7.14%, and three years ago rates were at 3.20%.
A year ago, the payment on a $500,000 house, with a 20% down payment and 7.60% 30-year mortgage rates, would be around $2,824 for principal and interest. The monthly payment for the same house, with house prices up 5.0% YoY and mortgage rates at 6.64%, would be $2,691 – a decrease of 4.7%.
However, if we compare to three years ago, there is huge difference in monthly payments. In 2021, the payment on a $500,000 house, with a 20% down payment and 3.20% 30-year mortgage rates, would be around $1,730 for principal and interest. The monthly payment for the same house, with house prices up 22.5% over three years and mortgage rates at 6.64%, would be $3,142 – an increase of 82%!
Mortgage Purchase Applications Remain Low
Here is a graph showing the MBA mortgage purchase index released last Wednesday. Purchase application activity is up from the lows in late October and early November, and still below the lowest levels during the housing bust.

And the next graph shows the refinance index since 1990. Refinance activity has increased recently as mortgage rates have declined, and anyone with a mortgage rate in the high 6% range or above has considered refinancing their mortgage. However, historically, refinance activity is still very low.

Asking Rents Mostly Unchanged Year-over-year
Here is a graph of the year-over-year (YoY) change for several rent measures since January 2015. Most of these measures are through August 2024, except CoreLogic is through July and Apartment List through September.
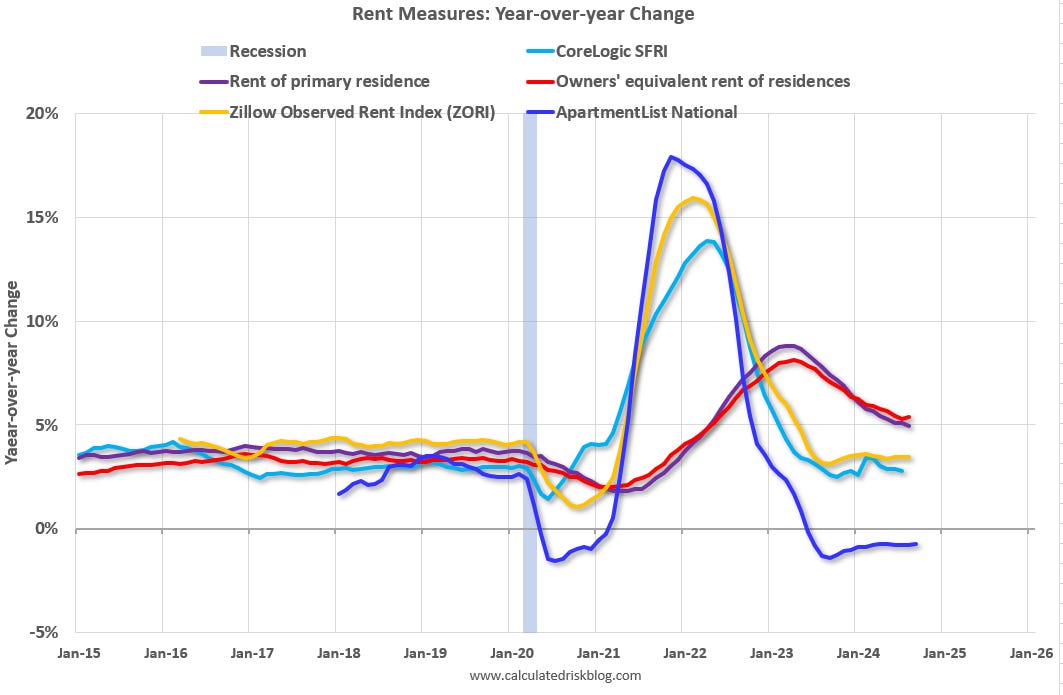
Asking rents are mostly unchanged YoY for multi-family (single family rents are up), and with new supply coming on the market, we will likely see further softness in asking rents.
However, the official measures are still catching up to the private data.
Low Levels of Delinquencies, Foreclosures and Real Estate Owned
Last month, I wrote Q2 Update: Delinquencies, Foreclosures and REO. In that article I noted that with substantial equity, and low mortgage rates (mostly at a fixed rates), few homeowners will have financial difficulties during this cycle.
Here is a graph of the current loan-to-value (LTV) of all outstanding mortgage loans from the FHFA’s National Mortgage Database through Q2 2024 showing most borrowers have substantial equity.

Almost 73% of borrowers have current LTVs under 60% (and this doesn’t include all the homes without a mortgage). And 91.7% of borrowers have LTVs under 80%. This is very different than during the housing bubble and bust, when a large percentage of borrowers had little or no equity.