CALCULATEDRISK
By Bill McBride
Yesterday, in Part 1: Current State of the Housing Market; Overview for mid-September I reviewed home inventory and sales.
House Prices
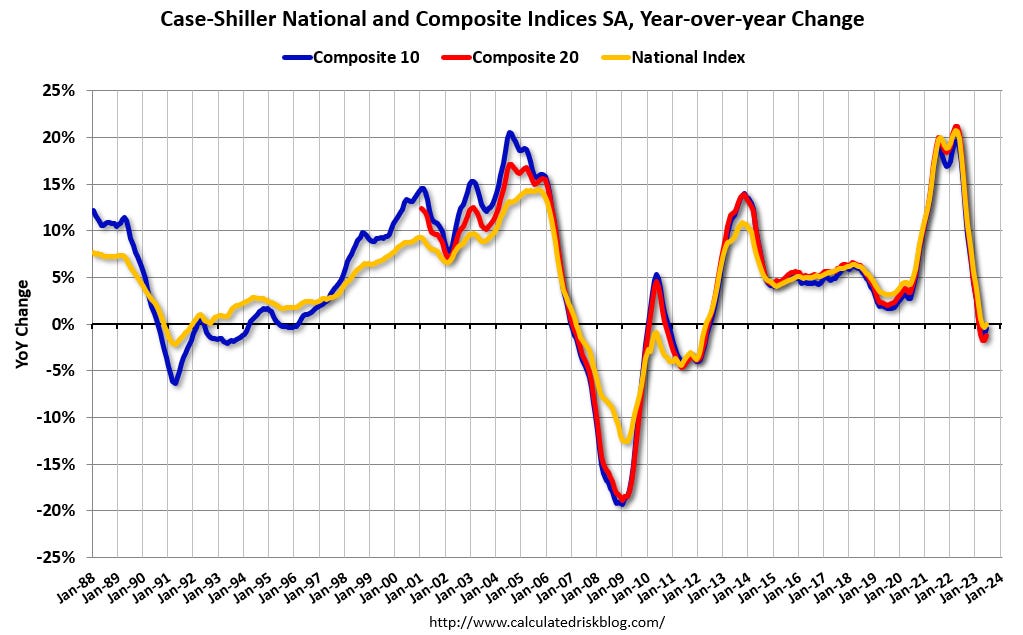
The Case-Shiller National Index was unchanged year-over-year in June and will turn positive YoY in July.
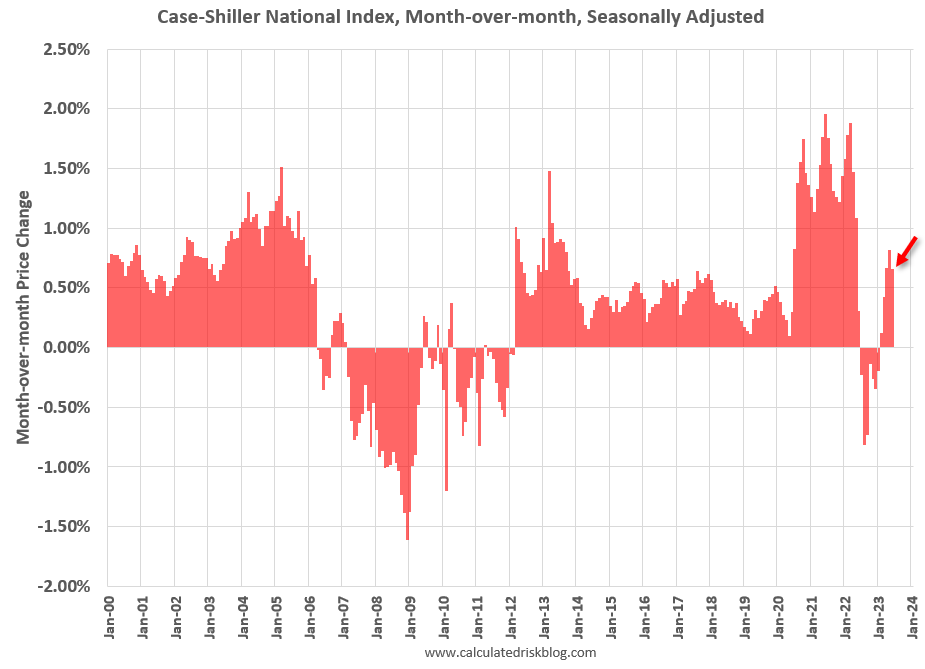
The MoM increase in the seasonally adjusted Case-Shiller National Index was at 0.65%. This was the fifth consecutive MoM increase following seven straight MoM decreases.
Most measures of house prices have shown an increase in prices over the last several months, and a key question I discussed in July is “Will house prices decline further later this year?” I will revisit this question soon.
Other measures of house prices suggest prices will be up YoY over the next few months in the Case-Shiller index. The NAR reported median prices were up 1.9% YoY in July, up from a 0.9% YoY decline in June. Black Knight reported prices were up 2.3% YoY in July to new all-time highs, and Freddie Mac reported house prices were up 2.9% YoY in July, up from 1.6% YoY in June – and also to new all-time highs.
Here is a comparison of year-over-year change in the FMHPI, median house prices from the NAR, and the Case-Shiller National index.
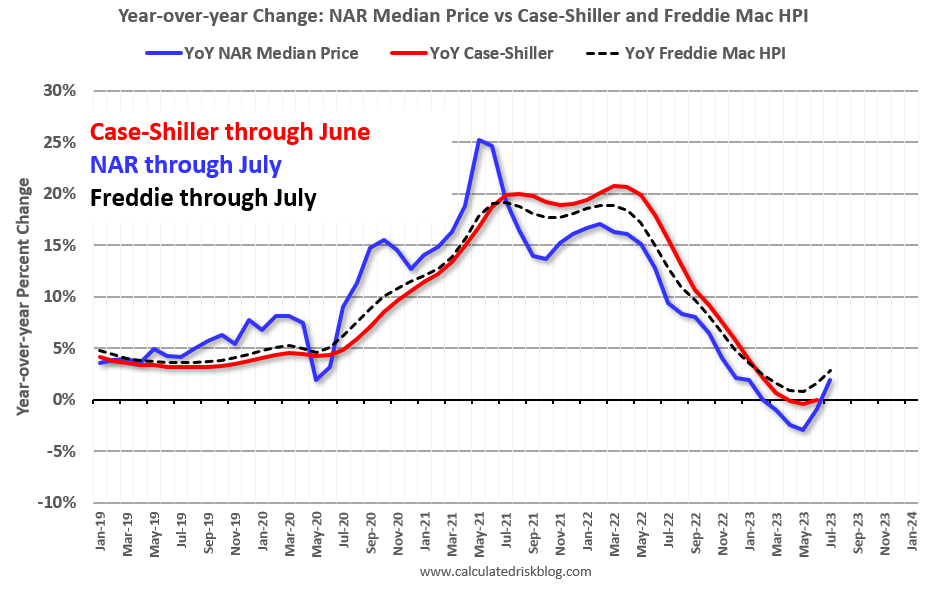
The FMHPI and the NAR median prices appear to be leading indicators for Case-Shiller. Based on recent monthly data, and the FMHPI, the YoY change in the Case-Shiller index will turn positive in the report for July.
In real terms, the Case-Shiller National index is down 3.9% from the peak, seasonally adjusted. Historically it takes a number of years for real prices to return to the previous peak, see House Prices: 7 Years in Purgatory.
30-Year Mortgage Rates are Holding Above 7%
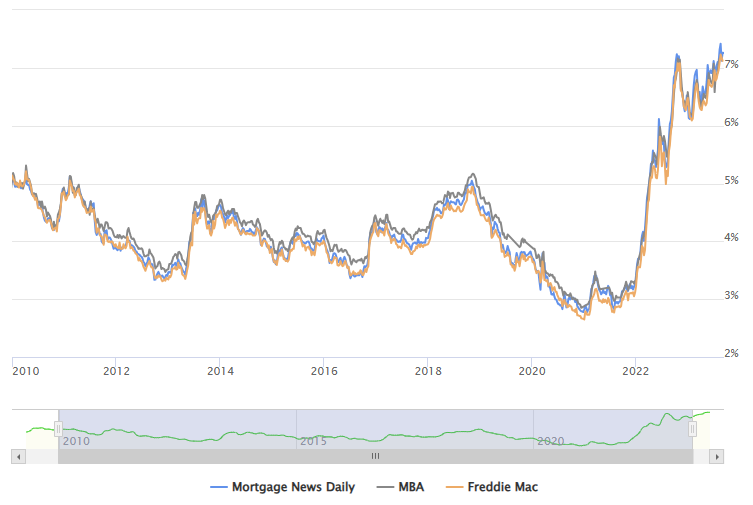
The following graph from MortgageNewsDaily.com shows mortgage rates since January 1, 2010. 30-year mortgage rates were at 7.22% on September 13th, near the recent high of 7.48% on August 21, 2023, and up year-over-year. A year ago, 30-year mortgage rates were at 6.28%.
A year ago, the payment on a $500,000 house, with a 20% down payment and 6.28% 30-year mortgage rates, would be around $2,471 for principal and interest. The monthly payment for the same house, with house prices unchanged YoY and mortgage rates at 7.22%, would be $2,721 – an increase of 10%.
However, if we compare to two years ago, there is huge difference in monthly payments. In September 2021, the payment on a $500,000 house, with a 20% down payment and 2.94% 30-year mortgage rates, would be around $1,674 for principal and interest. The monthly payment for the same house, with house prices up 17.9% over two years and mortgage rates at 7.22%, would be $3,207 – an increase of 92%! Almost double!!!
This increase in mortgage rates is probably the key reason new listings have declined sharply year-over-year – especially since a large number of homeowners refinanced at lower rates in 2020, 2021 and early 2022. Many potential move-up or move-down buyers have “golden handcuffs” and are unwilling to sell and give up their low mortgage payment.
See: Could 6% to 7% 30-Year Mortgage Rates be the “New Normal”?
Asking Rents Decline Year-over-year
Tracking rents is important for understanding the dynamics of the housing market. For example, the sharp increase in rents helped me deduce that there was a surge in household formation in 2021 (See from September 2021: Household Formation Drives Housing Demand). This has been confirmed (mostly due to work-from-home), and also led to the supposition that household formation would slow sharply now (mostly confirmed) and that asking rents might decrease in 2023 on a year-over-year basis.
Here is a graph of the year-over-year (YoY) change for several rent measures since January 2015. Most of these measures are through July 2023, except CoreLogic is through June and Apartment List is through August 2023.
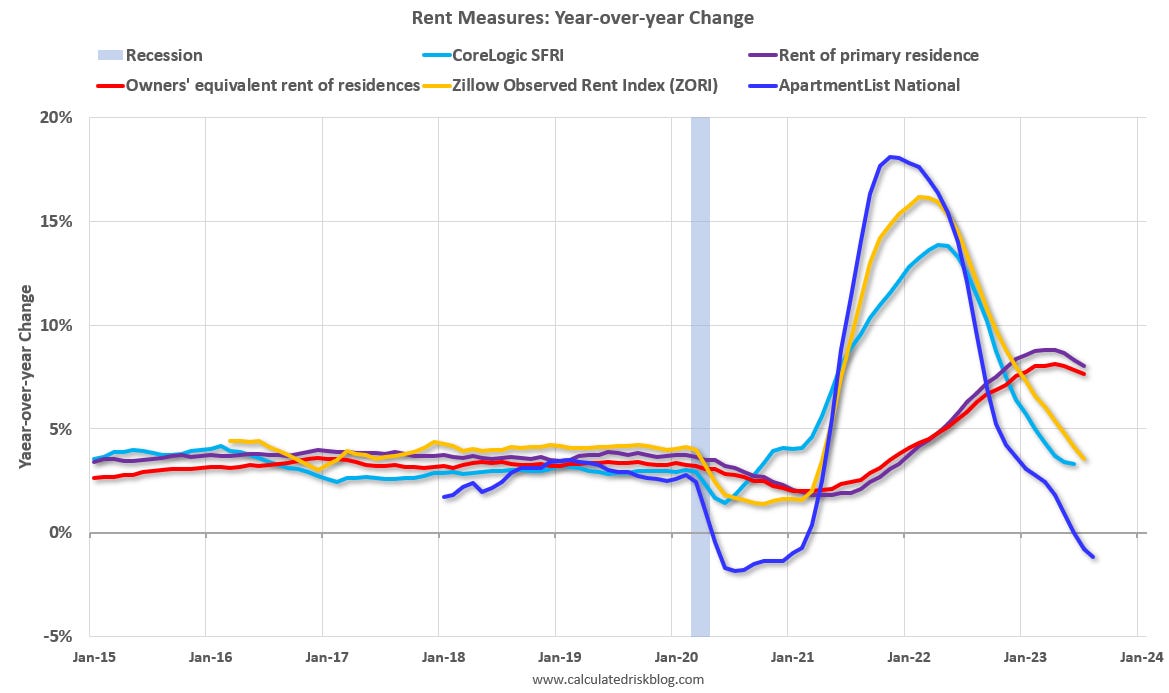
Asking rents are down YoY, and with new supply coming on the market, we will likely see further declines in asking rents.
Yesterday, the BLS noted in the CPI report: “The index for gasoline was the largest contributor to the monthly all items increase, accounting for over half of the increase. Also contributing to the August monthly increase was continued advancement in the shelter index, which rose for the 40th consecutive month.”
This is important for housing and also for monetary policy. Fed Chair Powell mentioned he was watching services less rent of shelter earlier this year when this measure was up 7.6% year-over-year. This has fallen sharply and is now up 3.1% YoY.

And here is a graph of the year-over-year change in shelter from the CPI report (through August) and housing from the PCE report (through July 2023).
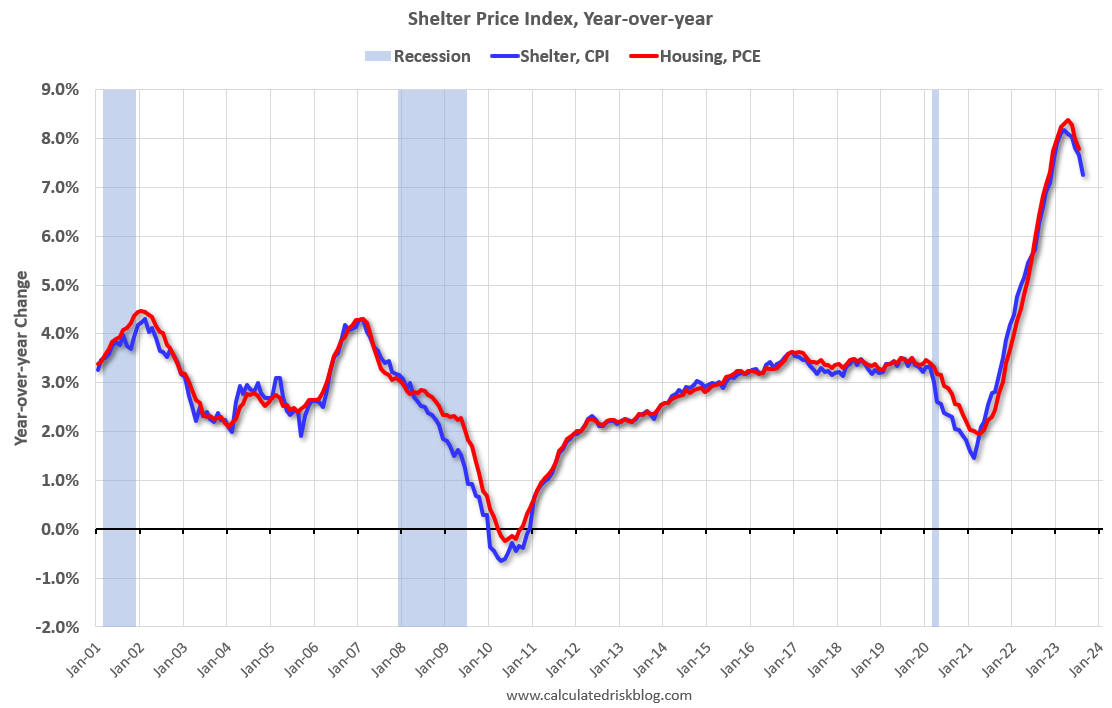
Shelter was up 7.2% year-over-year in August, down from 7.7% in July. Housing (PCE) was up 7.8% YoY in July, down from 8.0% in June. Shelter is still up sharply YoY due to increases in renewals, but with soft asking rents, we know the shelter index will continue to decline.
Low Levels of Delinquencies, Foreclosures and Real Estate Owned
On Monday, I wrote Q2 Update: Delinquencies, Foreclosures and REO. In that article I noted that with substantial equity, and low mortgage rates (mostly at a fixed rates), few homeowners will have financial difficulties during this cycle.
The bottom line is there will not be a huge wave of foreclosures as happened following the housing bubble. The distressed sales during the housing bust led to cascading price declines, and that will not happen this time.
Conclusions
We had seen a significant year-over-year decline in new and existing home sales; however, the new and existing home markets have diverged with new home sales increasing from the 2022 bottom. With the recent increase in mortgage rates, we might see further declines in existing home sales to new cycle lows.
House prices are under pressure due to higher mortgage rates, but prices are being supported by low levels of inventory. See: House Price Battle Royale: Low Inventory vs Affordability.
Existing home sales will likely be down less year-over-year NSA in August compared to July, however early local market data suggests seasonally adjusted sales in August will be close to or below the 4.07 million SAAR in July.
Multi-family housing starts will probably show fairly significant declines soon, since lending has tightened, and the Architectural Billings Index has shown a decline in multi-family billing for twelve consecutive months!