REAL TRENDS
By Mike Simonsen
I was expecting that this would finally be the week that the available inventory of homes for sale started rising across the country for the spring buying season. But no, inventory fell again. It’s now 10 weeks later in the year from the moment when inventory usually starts climbing. Normally by mid-April, inventory would have climbed 5-10% since the start of the year. This year, inventory has declined by 17%. Compared to 2022, this trend is a massive rebound of housing market conditions and home prices have stopped the declines we measured at that time.
We have a supply-constrained market. In most of the county, inventory levels have returned to the COVID-19 pandemic lows. There are very few people interested in selling homes they already own.
Inventory
This week there were only 66,000 new listings of single-family homes. 25% of those homes are already under contract. In 2022 at this time, there were 100,000 new listings, and 30% of them went into contract immediately. So yes, demand is lighter than the insanity of 2022. But, the quantity demanded exceeds the quantity supplied. 25% immediate sales is still a lot. 25% of those homes that got listed last week went into contract within a few days. The data shows us that while demand is lighter than last year, there are plenty of buyers competing for the limited supply of homes on the market.
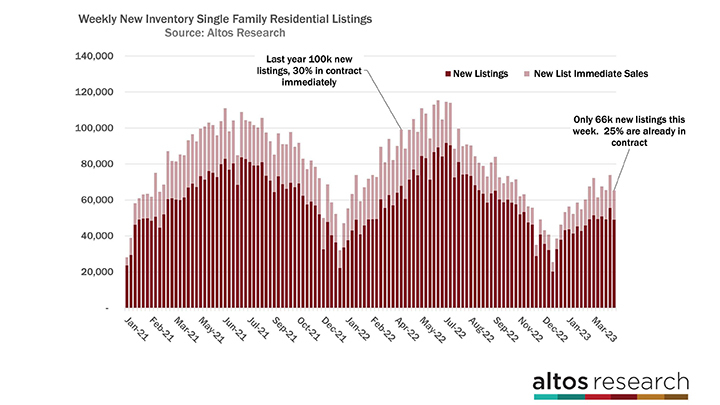
In the chart above of weekly new listings volume, you can see the spigot turned off on July 4, 2022. The seller volume dropped, and it has not recovered. This chart also shows how in normal times sellers are ramping up each week in the spring. At the right end of the chart, the data does not show that happening this spring.
There are three groups of potential sellers:
1. Life event movers.
These sellers are either moving up or moving down. What we know is that fewer people are moving, they’re staying in homes longer. This group is the mortgage lock-in group. It’s hard to change from a 2.8% mortgage to a 6% mortgage. But even if they have to move, for example, my brother is moving across the country to take care of his in-laws. His family will buy in Pennsylvania, but they’ll keep the ultra-cheap mortgage they have in DC. As a result, there is less inventory.
2. Investors.
Investors have purchased millions of homes across the U.S. in the last decade. We can observe that the biggest investors, the big institutional money has dramatically slowed purchasing, but none are selling their properties. There is no discernible inventory coming from investors.
3. Distressed homeowners.
When you lose your job, your income doesn’t keep up with inflation or other economic stress, you might be forced to sell. This group was the source of inventory in the 2008 crisis. As of right now, the U.S. still has near-record employment levels. Even the big layoffs in the tech sector are generally finding work quickly. So as of now, none of these people are selling either.
Every week the data continues to prove that homeowners have a really good deal, and they know it. This low-supply market will continue until something dramatically changes.
There are now just 405,000 single-family homes on the market across the country. That’s 57% more than last year at this time, but every week the difference is compressing. We could be back at record few homes on the market by the third quarter. Now, I don’t think that will happen, I continue to expect that inventory will build a little soon. Especially if the economy finally slows later this year, I’d expect inventory to climb then.
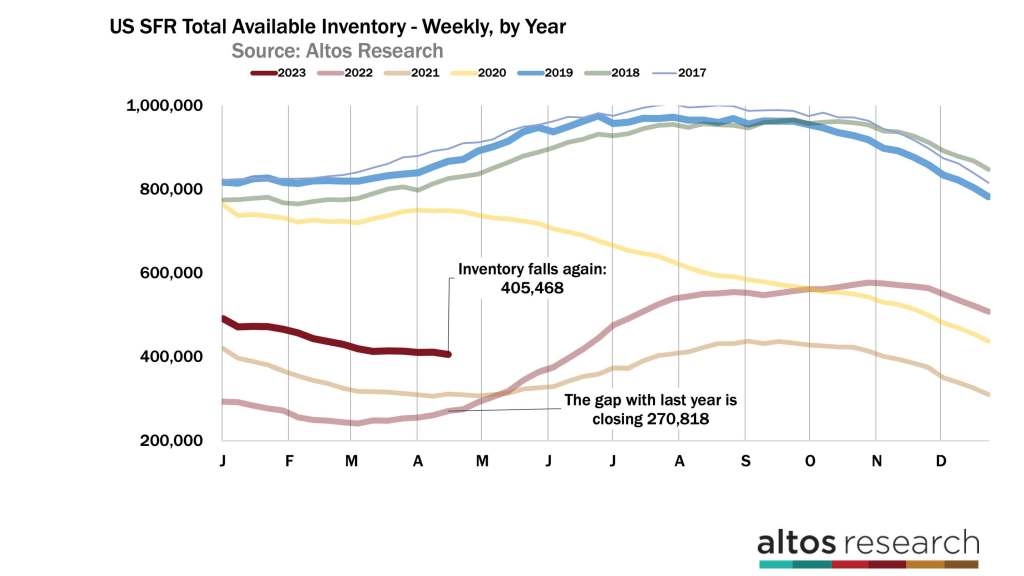
The fact is that most of the home buying happens before a June 30 peak, and we’re rapidly approaching that supposed “peak” for the year. Inventory usually climbs for 20 weeks from mid- February through June 30. We’re halfway through the seasonal cycle and yet inventory is still falling.
Prices
The tight inventory has not resulted in prices rising, but it has stopped prices from falling. Supply is tight, but affordability still restricts demand compared with 2022.
There are maybe just a few markets where prices still are moving down. For example, home prices in San Francisco proper are still declining. Tech job losses, remote work and unaffordability are driving so much of that price reduction. But the Bay Area metro — which covers 8 million people and 5 counties — is much more diverse and has stabilized from 2022.
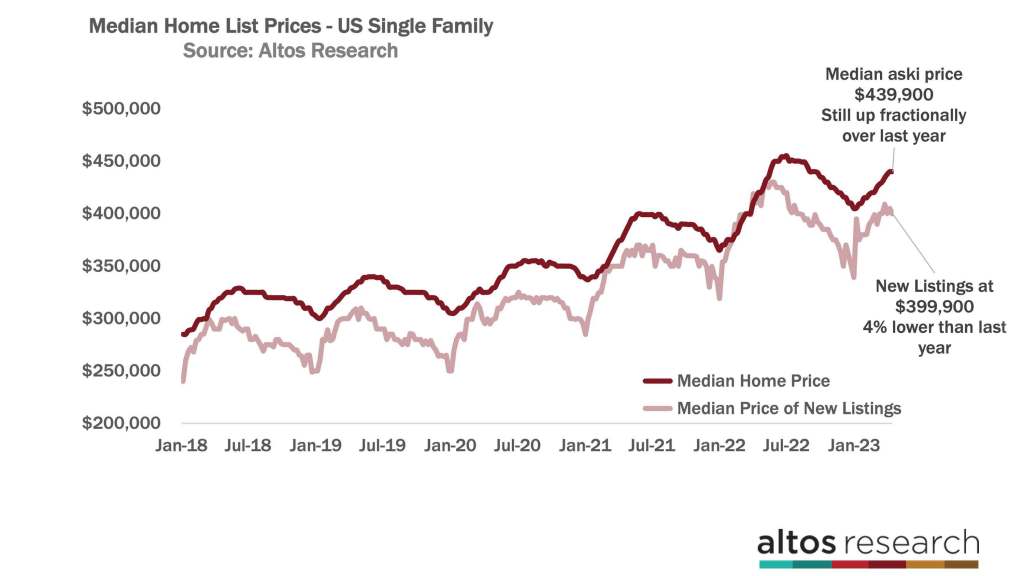
The median price of single family homes in the US is $439,900 this week. That’s unchanged from last week and is still a fraction higher than in 2022 at this time.
Two out of three Altos price measurements are lower than they were in 2022 at this time. In the spring of 2022, prices were still jumping each week. Prices corrected down just as quickly in the second half of the year. Now, they’re inching up. But the year-over-year comparisons get more negative each week.
The median price of the new listings is a few percent lower than 2022 at this time. The median price of the new listings now is $399,900. That data point is down from last week. In the chart below, you can see how the spread between the light and the dark lines is staying wide this year. In 2022, due to the insatiable demand, the price of the new listings was still jumping each week. The price of the new listings is a little noisy and jumps around a bit, but in general the price comparisons with last year will continue to get worse until July or so for a total of 0-5% price decline from 2022.
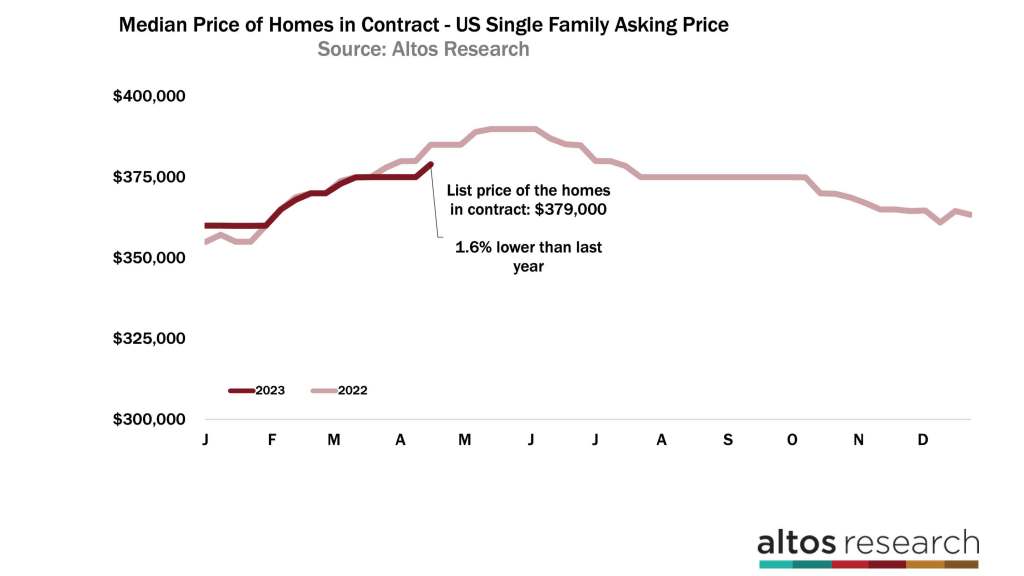
The third way to look at home prices is to examine the homes in contract, otherwise known as the pending sales data. The median price of the pending sales ticked up this week to $379,000. That’s also lower than 2022 at this time. These are the homes currently under contract for which the sales will close in April, May and June. Remember that the buyer demand in today’s data won’t show up in the headlines until July or August for the sales numbers. The headlines we hear now reflect buyer demand from back in November, December and January.
June is historically the seasonal peak of prices. Like the other price indicators, you can expect that our year-over-year comparisons will get worse until July. You can see the light line in this chart represents the pending sales prices each week from 2022. Prices this year — the dark red line — have been at or below the 2022 point since mid-February. The bidding wars and overbidding of the sales prices of 2022 came in higher than this. So we can see that home prices are a few percent lower than 2022 at this time. And that the headlines reporting negative home price change will keep coming for several more months, even though the pending sales prices are actually ticking up.
The housing market data currently shows that demand is higher than the available supply. Fewer homes are taking a price cut each week. 29.8% of the single-family homes on the market have had a price cut. That’s a fraction fewer than last week. It’s going to be fascinating to see if this demand indicator continues to improve and surpasses the 2019 levels in the next few weeks. Does the dark red line here go below the blue in the coming weeks?
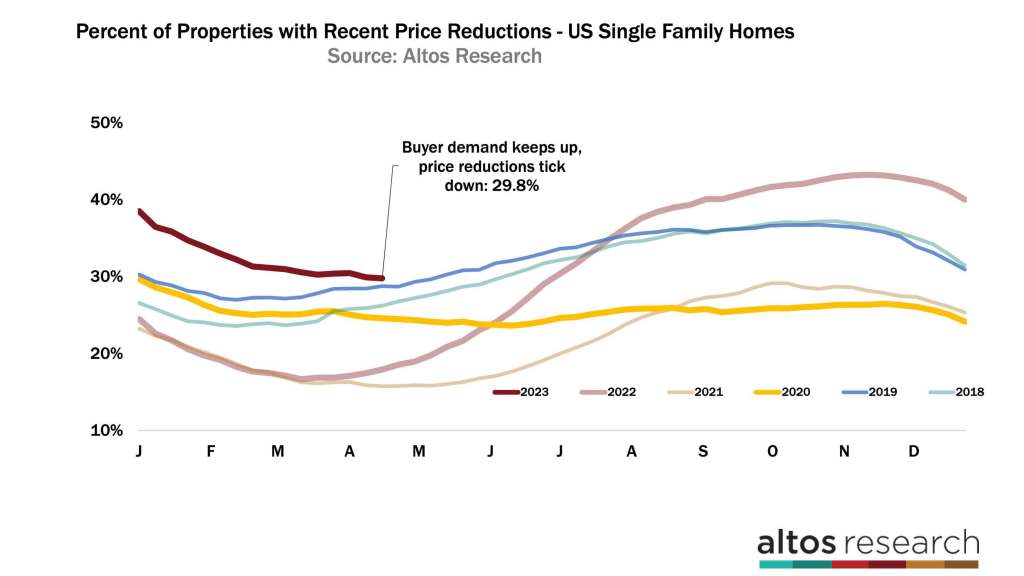
A few weeks ago Redfin released a report that said home sales completed in February had the most price cuts on record in their data. That highlights an interesting nuance between our datasets. In this chart, we’re watching the active market. 29.8% of homes have had a price cut. That Redfin report was measuring the sales that closed in February. Homes that were on the market and cut their prices in November and December to get their offers. See the peak of this chart in late November 2022? What we also know is that when Redfin releases the same report for March sales, the price reductions will be fewer. April sales fewer still etc. We can see all the way until June sales data which we’ll see in July.
The takeaway here is this: we can already see the price strength in housing market all the way through mid-summer at least. If you have a hypothesis about home prices falling in 2023, that trend can’t even start until the 3rd quarter at the earliest. Home prices for 2023 are not showing any signs of further price decline. It all happened in 2022. Maybe that changes later, but not yet.
A true data geek, Mike founded Altos Research in 2006 to bring previously unavailable insights on the US housing market to those who need it. The company now serves the largest Wall Street investment firms, banks, and tens of thousands of real estate professionals around the country. During the pandemic, Mike used Altos Research data to identify trends in the real estate market well before the headlines, and his work was recently featured in the New York Times, The Atlantic and other publications. Mike was also the 2020 president of the San Francisco Chapter of the Entrepreneurs’ Organization, a group in which he gets to lead and learn from hundreds of the most exciting entrepreneurs in the world.