CALCULATEDRISK
By Bill McBride
Although inventory is well below normal levels, so are sales. I think we need to keep an eye on months-of-supply. Historically nominal prices declined when months-of-supply approached 6 months – and that is unlikely this year – but we could see months-of-supply back to 2019 levels later this year.
What would it take to get months-of-supply back to 2019 levels by mid-year? The following table is a simple exercise. If sales stay depressed at 2023 levels, how much would inventory have to increase to put months-of-supply at 2019 levels?
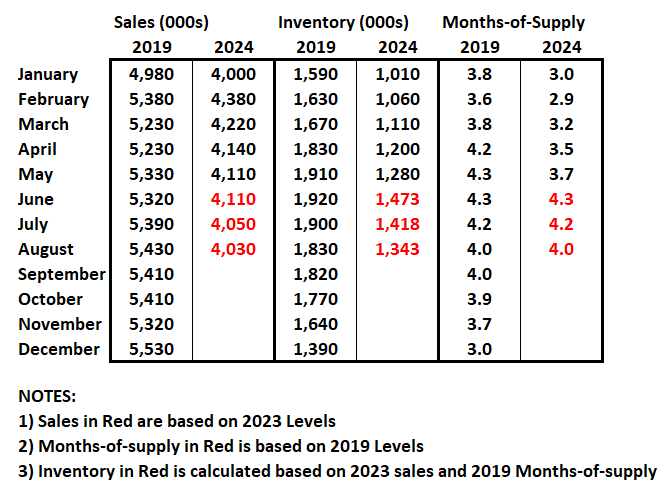
The answer is – if sales continue to track last year – NAR reported inventory would have to increase to around 1.4 million by July for months-of-supply to match 2019 levels. That would be a 11% increase from the May levels, but still leave inventory about 23% below 2019 levels.
An increase to 2019 levels of months-of-supply wouldn’t suggest falling prices, but it would likely lead to a slowdown in price increases. In 2019, the Case-Shiller National index increased 3.8% YoY.
The following graph shows months-of-supply since 2017. Note that months-of-supply is higher than the last 3 years (2021 – 2023), and below the 2017 – 2019 period. In 2020 (black), months-of-supply increased at the beginning of the pandemic and then declined sharply.
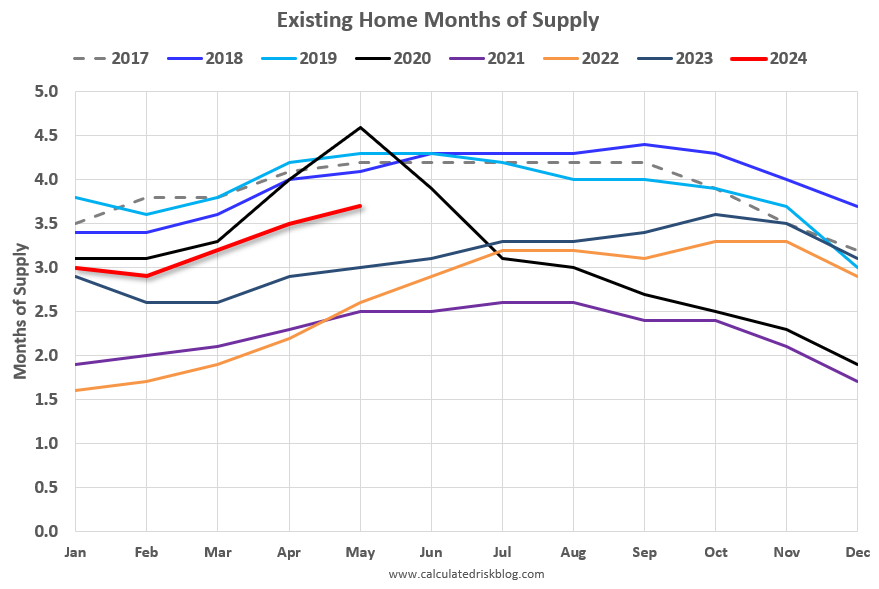
The Case-Shiller National index increased 6.2% in 2017, 4.6% in 2018, and 3.8% in 2019. In 2022, we saw some price declines at the National level even with fairly low months-of-supply – probably due to the sharp increase in inventory. Inventory would probably have to increase to above 5 or even 6 months of supply to see national price declines again.
Realtor.com recently reported for May:
There were 35.2% more homes actively for sale on a typical day in May compared with the same time in 2023, marking the seventh consecutive month of annual inventory growth. … However, while inventory this May is much improved compared with the previous three years, it is still down 34.2% compared with typical 2017 to 2019 levels.
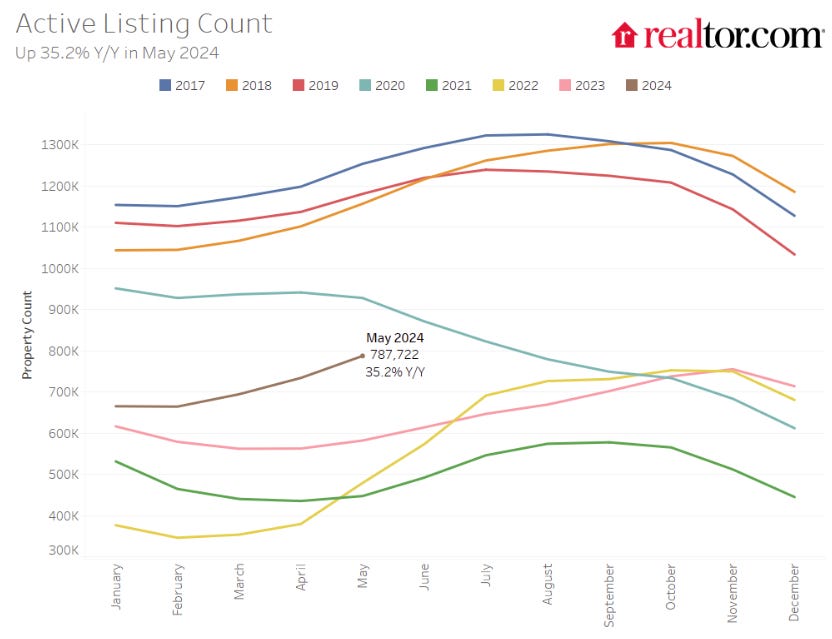
Using the Realtor.com data, inventory would have to increase by about 12% to around 880 thousand for months-of-supply to be back to 2019 levels by July. This is possible.
Note that months-of-supply is calculated using the Seasonally Adjusted (SA) sales rate, and the Not Seasonally Adjusted (NSA) levels of inventory. Months-of-supply was actually back to 2019 levels in December (for just one month).
Inventory and months-of-supply will be something to watch carefully all year!