CALCULATEDRISK
By Bill McBride
Both inventory and sales are well below normal levels, and I think we need to keep an eye on months-of-supply to forecast price changes. Historically nominal prices declined when months-of-supply approached 6 months – and that is unlikely this year – but we could see months-of-supply back to 2019 levels in the next month or two.
As I mentioned in a recent interview with Lance Lambert at ResiClub:
“I expect this measure to continue to increase, and be over 4 months soon – and to be above 2019 levels in a few months. This doesn’t mean national price declines, but it suggests price growth will slow significantly later this year. We might see national price decline with months-of-supply above 5 (as opposed to 6) since most potential sellers have substantial equity and might be willing to sell for a little less.”
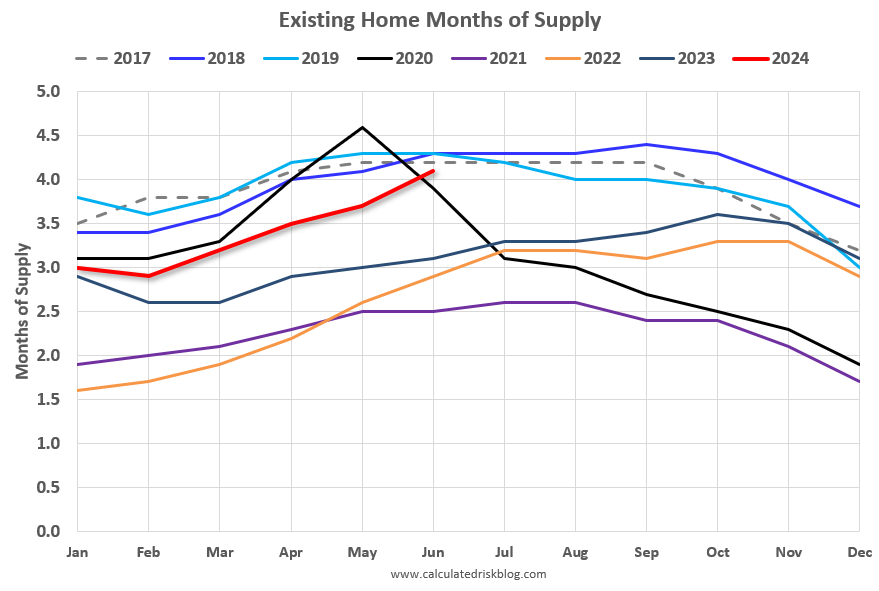
Months-of-supply was at 4.1 months in June compared to 4.3 months in June 2019. Note that months-of-supply peaked at 4.3 months in May and June 2019 and then declined to 4.2 months in July 2019.
What would it take to get months-of-supply back to 2019 levels in July? And what would it take to get months-of-supply above 5 months? The following table is a simple exercise. If sales stay depressed at 2023 levels, how much would inventory have to increase to put months-of-supply at 2019 levels in July?
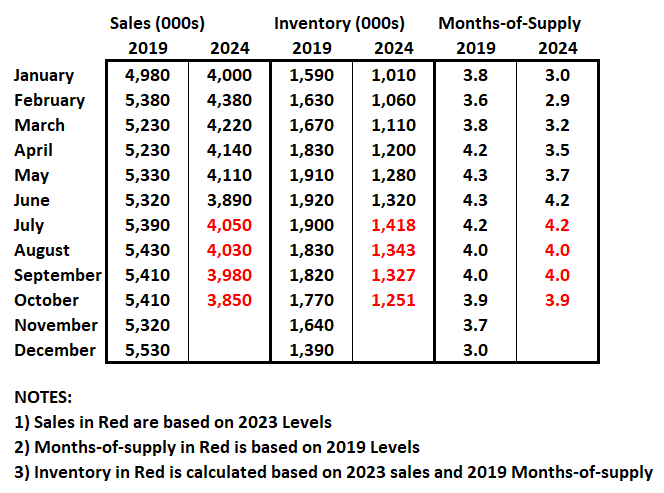
The answer is – if sales continue to track last year – NAR reported inventory would have to increase to around 1.4 million by July for months-of-supply to match 2019 levels. That would be a 7% increase from the June levels, but still leave inventory about 25% below 2019 levels.
An increase to 2019 levels of months-of-supply wouldn’t suggest falling prices, but it would likely lead to a slowdown in price increases. In 2019, the Case-Shiller National index increased 3.8% YoY.
It seems very unlikely we will see 5 months-of-supply this year, but that might be a 2025 story.
The following graph shows months-of-supply since 2017. Note that months-of-supply is higher than the last 3 years (2021 – 2023), and below the 2017 – 2019 period. In 2020 (black), months-of-supply increased at the beginning of the pandemic and then declined sharply.
The Case-Shiller National index increased 6.2% in 2017, 4.6% in 2018, and 3.8% in 2019. In 2022, we saw some price declines at the National level even with fairly low months-of-supply – probably due to the sharp increase in inventory. Inventory would probably have to increase to above 5 months of supply to see national price declines again.
Realtor.com recently reported for June:
There were 36.7% more homes actively for sale on a typical day in June compared with the same time in 2023, marking the eighth consecutive month of annual inventory growth. This is also an acceleration from May, which was up 35% year-over-year. In the eight consecutive months of increasing inventory, the rate of growth in each subsequent month has increased. While inventory this June is much improved compared with the previous three years, it is still down 32.4% compared with typical 2017 to 2019 levels.
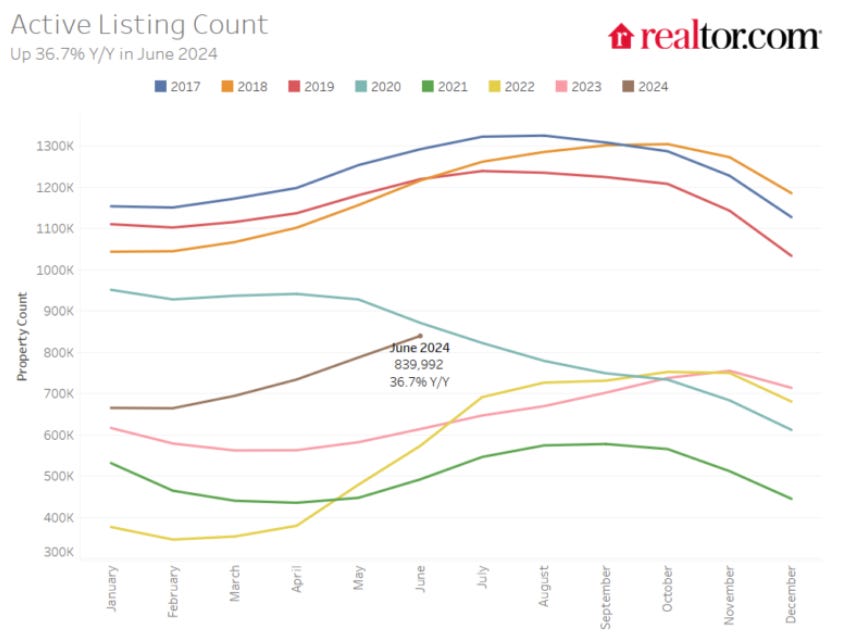
Using the Realtor.com data, inventory would have to increase by about 5% to around 880 thousand for months-of-supply to be back to 2019 levels by July. This is possible.
Note that months-of-supply is calculated using the Seasonally Adjusted (SA) sales rate, and the Not Seasonally Adjusted (NSA) levels of inventory. Months-of-supply was actually back to 2019 levels in December (for just one month).
Inventory and months-of-supply will be something to watch carefully all year!