CALCULATEDRISK BY BILL MCBRIDE
Both inventory and sales are well below pre-pandemic levels, and I think we need to keep an eye on months-of-supply to forecast price changes. Historically nominal prices declined when months-of-supply approached 6 months – and that is unlikely any time soon – however, as expected, months-of-supply is above 2019 levels.
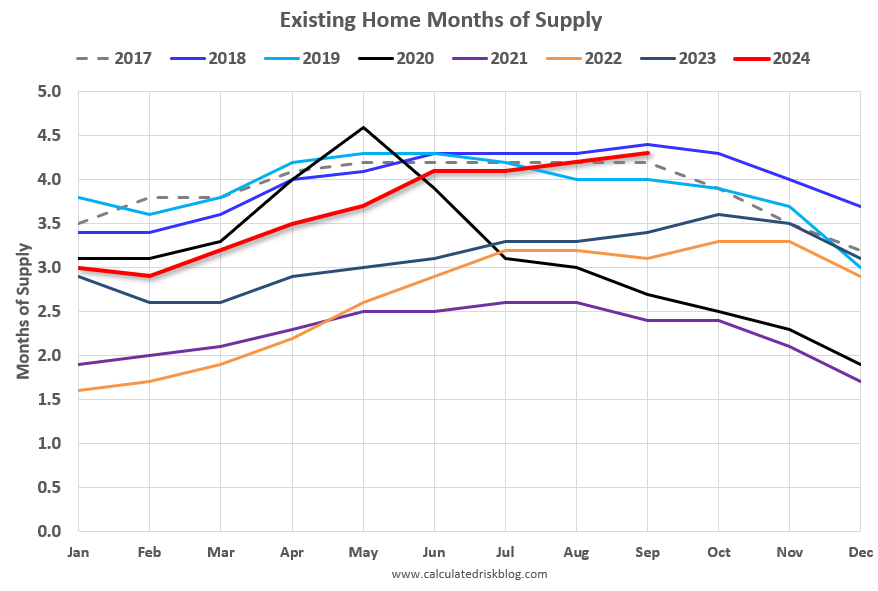
Months-of-supply was at 4.3 months in September compared to 4.0 months in September 2019. Even though inventory has declined significantly compared to 2019, sales have fallen even more – pushing up months-of-supply.
The following graph shows months-of-supply since 2017. Note that months-of-supply is higher than the last 5 years (2019 – 2023), and just below the level in September 2018. Months-of-supply was at 4.2 in September 2017 and 4.4 in September 2018. In 2020 (black), months-of-supply increased at the beginning of the pandemic and then declined sharply.

Note the seasonal pattern. I’m using the NSA months-of-supply, and that will decline over the next few months before increasing in the Spring.
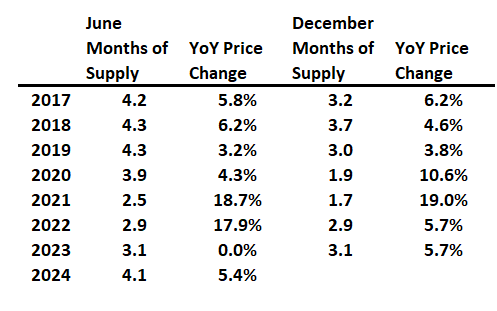
The Case-Shiller National index increased 6.2% in 2017, 4.6% in 2018, and 3.8% in 2019. In 2023, we saw some price declines at the National level even with fairly low months-of-supply – probably due to the sharp increase in inventory.
The following table shows the Months-of-supply (NSA) and the year-over-year house price change (Case-Shiller National Index) for June and December. The relationship isn’t perfect, but generally more inventory equals smaller price increases.

If months-of-supply is near 4 months in December – and above 2018 levels – then there is a good chance we will see 5+ months-of-supply by next June. And that might mean soft prices. That is something I’ll be watching carefully.
