By Mike Simonsen
Inventory looks to be finally climbing for the spring. The data shows the most new listings this week since September. A nice little increase. This number is still 10% fewer listings each week compared to 2022, but at least it looks like the market is loosening up a bit.
The sales rate is climbing at a very normal pace too. It is not spiking. Due to the limited supply of homes to buy, and a worse affordability scenario, the sales pace is running 15-20% lower than 2022. It’s really a supply-constrained market. And we’ll get to test that statement as supply loosens up.
Altos is going to start publishing these weekly videos on our podcast feed for audio-only. So if you prefer to get the data just on the audio, it’ll be there for you. If you haven’t found the Altos Research podcast, it’s called Top of Mind. I interview really great guests about their perspectives on real estate, the market, the broader economy and the future of this industry. I do a few interviews per month. You can find that on the Altos blog and wherever you get your podcasts. I’ll link to that in the comments below.
Inventory
This week, the market saw the most new listings in one week since September 2022. 80,000 single-family homes hit the market. 21,000 of those went into contract almost immediately, so we can see the demand is definitely there for new supply. See the nice spike for the bar at the far right of the chart below.
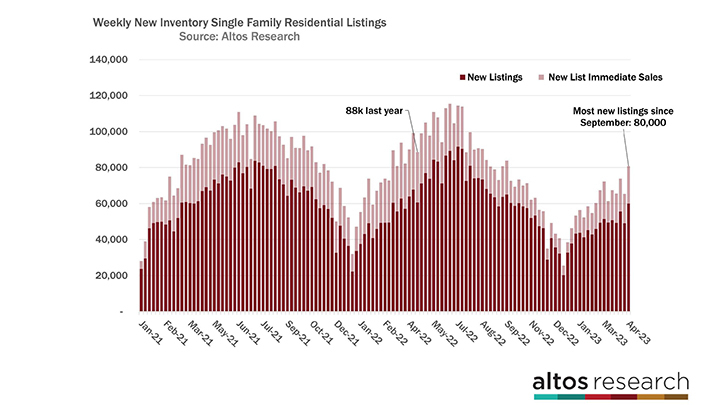
The light-colored portion of each bar in the chart represents the immediate sales metric. With over 20,000 new listings under contract, this week had the most immediate sales since July 2022. July is the peak of the market every year and last year it had the added pressure of dramatically shrinking affordability. Demand fell off quickly in the second half of 2022. Now, we can see more normal seasonal behavior. There are more sales in the spring and the limited inventory is really holding back more sales from happening. People are buying basically everything that’s available.
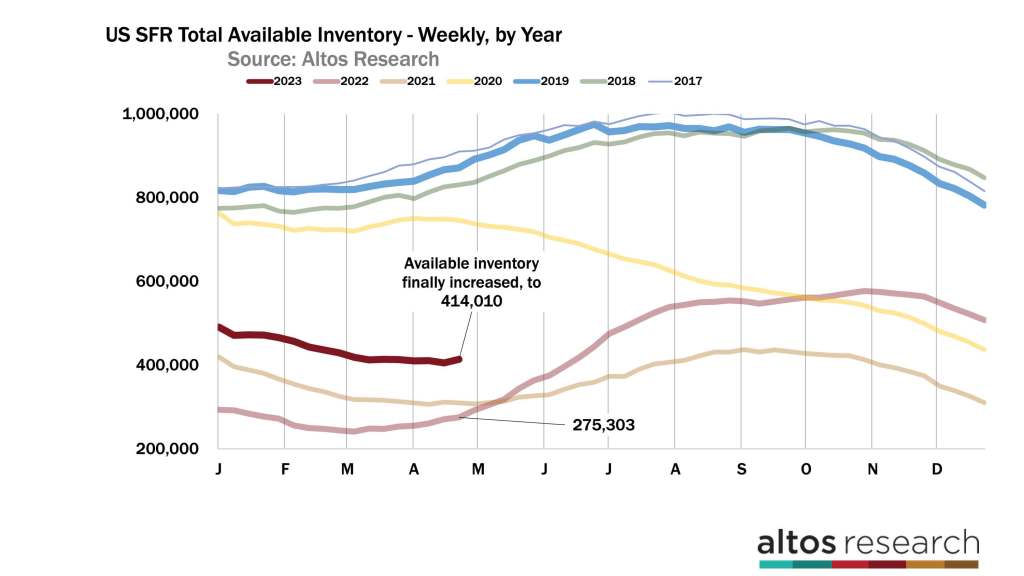
And with the bump in new listings came the first real increase in active inventory of the year. There are now 414,000 single-family homes on the market across the U.S. That’s up 2% from last week. There are 50% more homes on the market now than in 2022 at this time, but of course, there are 50% fewer homes on the market than in just 2019.
There has been such a restricted supply market, and I’ve been talking about how we’d have more sales if there was more supply available. Now we get to confirm that statement. As sellers finally start testing the market, the data should show a climb in pending sales. Some people analyze mortgage applications as a proxy for housing demand, and since applications are at low levels they presume demand is too. But this is a supply-constrained market, so the mortgage application rate should climb too with more supply. I’ll be keeping an eye on that data to see if my assumptions are true.
The dark red line represents this year, and it had a little bump this week but is still way below the normal levels. In 2022 at this time, inventory was climbing 2-4% per week. This was the first 2% week of 2023, so it looks like the inventory will continue to climb for a couple of months now. The inventory forecast model projects another 2% increase this week. Hopefully, home buyers start seeing some better options and fewer bidding wars as summer arrives.
Fewer and fewer sellers need to take a price cut. This week the percentage of homes on the market with a price reduction dropped to 29.4% of the market. Almost back under the levels of 2019. Since the fresh inventory is coming later than normal this year, the low point of price reductions will come later too. It takes a month or so of that new inventory, some of which is overpriced, to get the message. So in May, the data will show an increase in price reductions again. Normally the homes that got listed in February and March that didn’t yet get offers will now start to take price cuts and the normal curve is increasing a month or two after inventory started increasing. This year, since inventory has been falling, the turn of price cuts is delayed too.
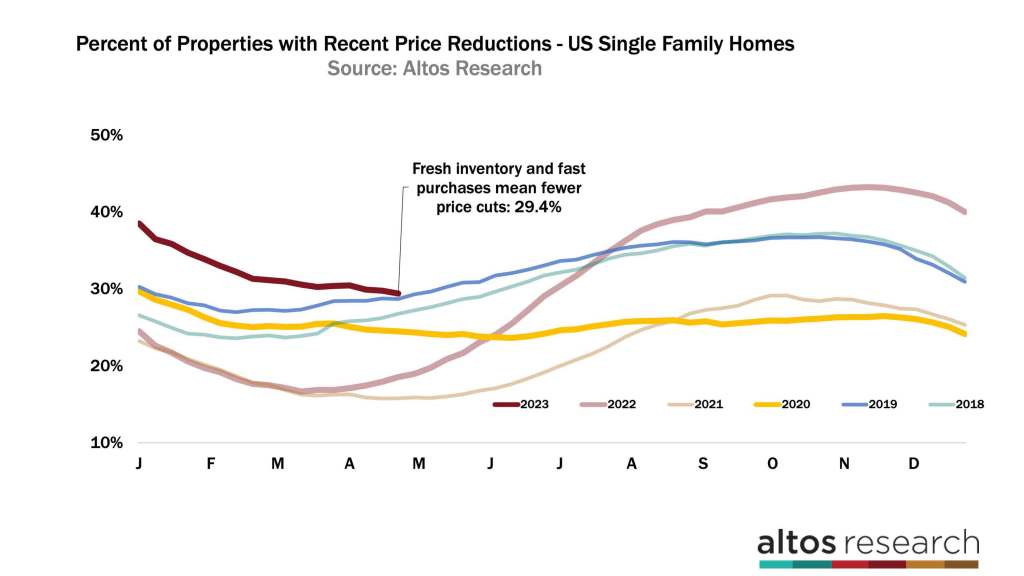
The picture we get is one of a much healthier market than we had in 2022. There are many more buyers. See the dark red line is still moving lower. If you’d asked me at the start of 2023 whether we’d recover this completely, there’s no way I would have guessed it.
Price
The median price of single-family homes in the US is $444,481 this week. That’s up a percent from last week. These are not spiking home prices. Prices have stopped the decline that you’ll still see in the news headlines. That’s behind us, at least until something else in the economy changes.
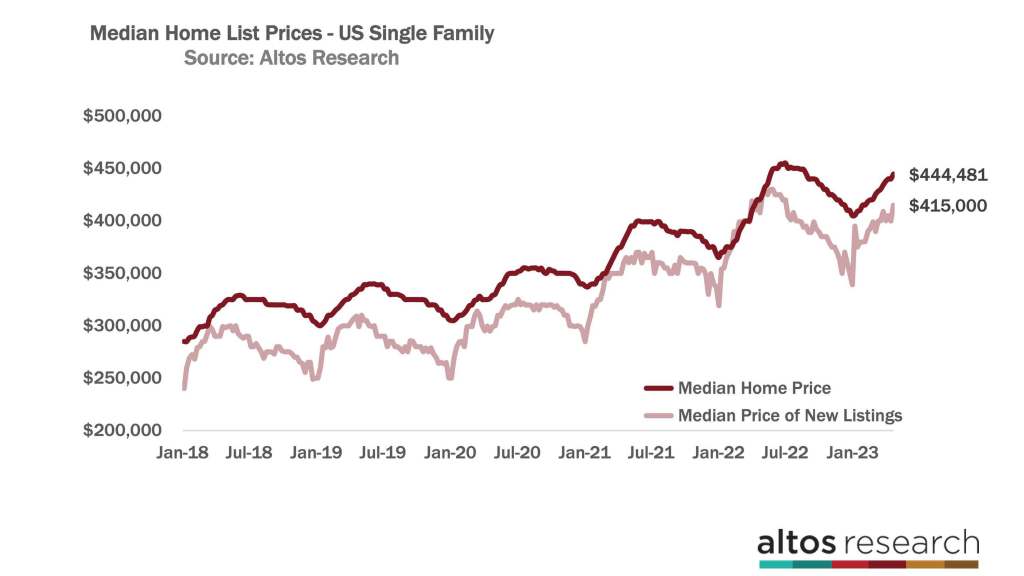
The median price of the new listings had a healthy jump this week to $415,000, reflecting both the time of year and the underlying demand that sellers know is there in most markets around the U.S. The price of the new listings is a very forward leading indicator. The homes that get listed today reflect the wisdom that the sellers and listing agents know about the buyer demand locally, and they price to that. They take offers in May and those sales close in June and July. And we hear about it in August. So the new listings is the earliest leading indicator of future home sales prices. The signals right now are not bad.
Remember that because we have fewer price cuts now, that means the homes currently on the market are receiving offers at their list prices. So, sales prices in the future will not be falling. This is a message that’s very hard for some people to understand. People read the headlines like Case Shiller, which looks at closed sales prices, and they see a falling trend. Tomorrow the Case Shiller index will be released for February. It’ll include sales data from December and January too. Those were homes that took price reductions in November — which was the peak of the price cuts. The Case Shiller will be down again tomorrow. So the important thing to note is that the market tells us now that the sales happening in May and June are not under price pressure like they were 6 months ago. We have visibility to those future sales.
The median price of the pending sales — the homes that are in contract — is closer to the sale price. This week the median price of those pending sales increased to $379,500. Again, it’s spring, prices climb in the spring. In the Altos data, we don’t do any adjustments. Right now, homes are selling at 1.4% lower prices than 2022 at this time. The data from 2022 was still reflecting the momentum of the COVID-19 pandemic frenzy. So the price comparisons with 2022 will continue to get worse for the next couple of months. In 2022 the pending sales price had climbed by 8% so far in the year. This year the pending sales price has climbed by only 5%. In this chart, the dark red line is the curve from this year. The light red line represents 2022.
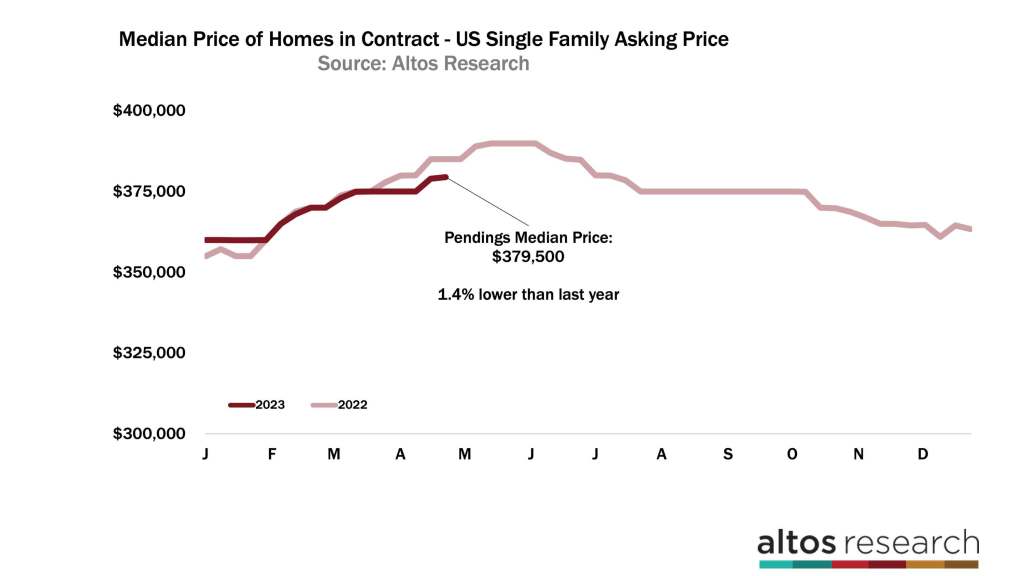
When you’re watching for the next turn in the market, like a recession hitting harder or maybe mortgage rates climbing up again, the pending sales price will be an excellent confirmation of things slowing down again. Keep watching this data point.
As I mentioned, the sales rate is climbing too, at a very normal spring pace. Again, this is not seasonally adjusted. Due to the limited supply of homes to buy and of course less crazy demand, the sales pace is running 15-20% lower than in 2022. That’s a million fewer home sales in 2023 than the year prior.
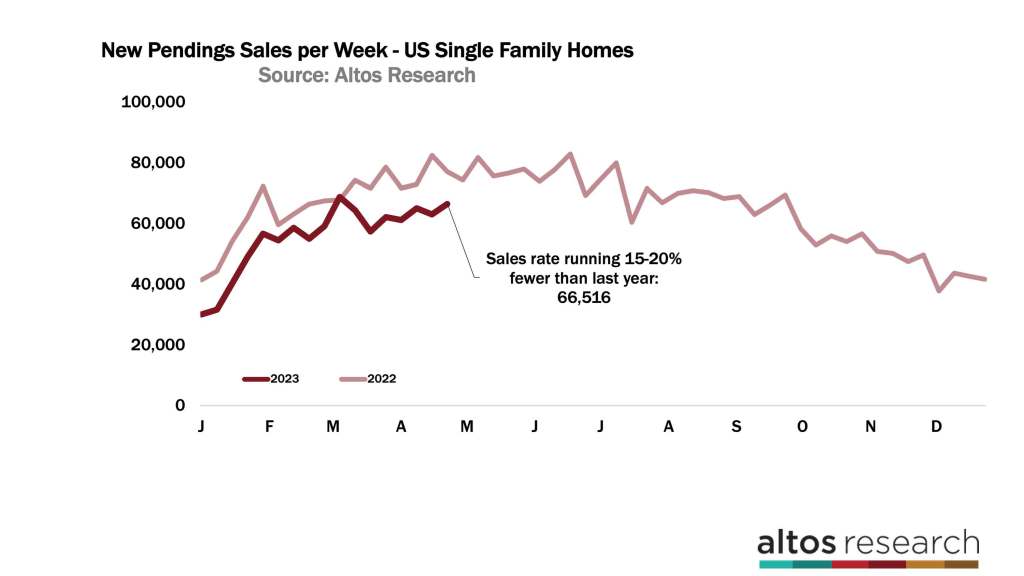
Again in this chart the dark red line represents this year. It’s climbing for spring but it’s not climbing quickly. We’re supply constrained. There is a cap on how many homes could be purchased right now. It’ll be really fascinating to watch the pending sales rate after September this year to see if the late-year demand is better than the ice-cold fourth quarter of 2022. But that’s later in the year. What we can see now is that until supply climbs we’ll have limited sales.
A true data geek, Mike founded Altos Research in 2006 to bring previously unavailable insights on the US housing market to those who need it. The company now serves the largest Wall Street investment firms, banks, and tens of thousands of real estate professionals around the country. During the pandemic, Mike used Altos Research data to identify trends in the real estate market well before the headlines, and his work was recently featured in the New York Times, The Atlantic and other publications. Mike was also the 2020 president of the San Francisco Chapter of the Entrepreneurs’ Organization, a group in which he gets to lead and learn from hundreds of the most exciting entrepreneurs in the world.