Year-over-year Rent Growth Continues to Decelerate
CALCULATEDRISK
Asking Rents Likely to be Down year-over-year in June or July
By Bill McBride
racking rents is important for understanding the dynamics of the housing market. For example, the sharp increase in rents helped me deduce that there was a surge in household formation in 2021 (See from September 2021: Household Formation Drives Housing Demand). This has been confirmed (mostly due to work-from-home), and also led to the supposition that household formation would slow sharply now (mostly confirmed) and that asking rents might decrease in 2023 on a year-over-year basis.
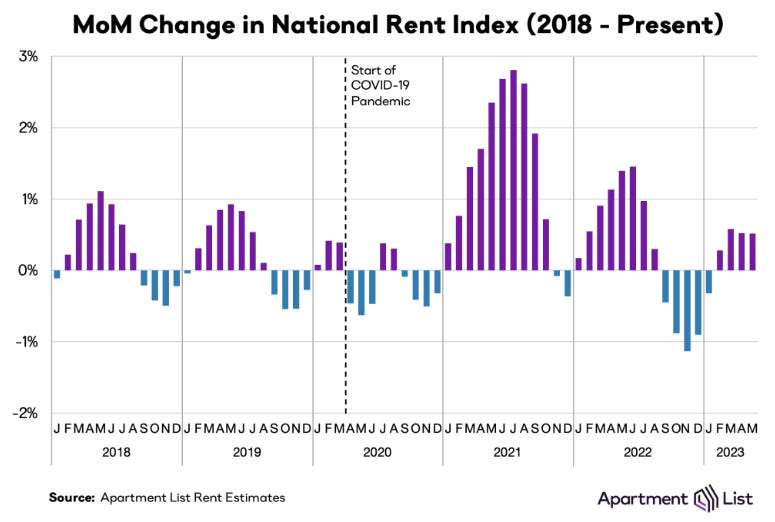
Welcome to the June 2023 Apartment List National Rent Report. Our national rent index increased by 0.5 percent over the course of May. This is the fourth straight monthly increase in rent prices, but rent growth is flattening out at a time of year when it’s normally picking up steam. Rent growth this year is coming in slower than average, and even though prices are trending up again, a combination of sluggish demand and increasing supply is keeping prices in check.
Year-over-year rent growth is continuing to decelerate, and now stands at just 0.9 percent, its lowest level since March 2021. Year-over-year growth is now solidly below the average rate from 2018 to 2019 (2.8 percent), and could possibly even dip into slightly negative territory in the months ahead.
As we’ve explored in detail, much of the 2021 rent boom was attributable to a tight market in which more households were competing for fewer vacant units. Our vacancy index spiked above 7 percent in the early months of the pandemic in 2020, as many Americans consolidated households and moved in with family amid the uncertainty and economic disruption of the pandemic’s onset. After that, however, rapid household formation drove a sharp tightening of the vacancy rate, which eventually fell to a low of 4.1 percent in fall 2021.
But after bottoming out at 4.1 percent in October 2021, our national vacancy index has been gradually easing for over a year and a half, and the rate of easing has picked up steam since last summer. From January through August of last year, our vacancy index was inching up by an average of 11 basis points per month; but from last September through this month, the average increase has been 21 basis points per month. The vacancy rate now sits at 7 percent, which is higher than the average 6.6 percent rate from 2018 to 2019, and nearing the pandemic peak of 7.2 percent reached in July 2020.
This easing has shown no signs of slowing, and it’s likely that the vacancy rate will continue to trend even further upward in the months ahead. New apartment construction is recovering from pandemic-related disruptions, and there are now more multifamily units under construction than at any point since 1970.
In April 2023, the U.S. rental market experienced single-digit growth for the ninth month in a row after fifteen months of slowing from a high of 16.4% growth in January 2022. Median rent across the top 50 metros was up just 0.3% year-over-year for 0-2 bedroom properties, the lowest growth rate since the onset of the pandemic.
Annual single-family rent growth wound down to 4.3% in March, marking nearly a year of decelerating gains. All tracked metros posted lower rent growth than in March 2022. Las Vegas and Phoenix saw rents decline year over year, mirroring trends observed in CoreLogic’s most recent home price data. Charlotte, North Carolina topped the list for the highest rent growth in March, but the 7.7% increase for this metro was well below that of the 25-to-41% gains recorded for top metros in March 2022. …
“Single-family rent price gains continued to slow year over year in March, with growth at about one-third of the rate as observed one year earlier,” said Molly Boesel, principal economist at CoreLogic. “The slowdown is more pronounced in the higher-priced tier, where growth is now about the same as it was before the pandemic. However, gains in the lower tier are still twice the pre-pandemic rate, with all tracked metro areas posting increases at that price level.”
The 4.3% YoY increase in March was down from 5.0% in February.
Rent Data
Here is a graph of several measures of rent since 2000: OER, rent of primary residence, Zillow Observed Rent Index (ZORI), ApartmentList.com and CoreLogic Single Family Rental Index (All set to 100 in January 2017)
OER and rent of primary residence have mostly moved together. The Zillow index started in 2014, the ApartmentList index started in 2017, and CoreLogic in 2004.
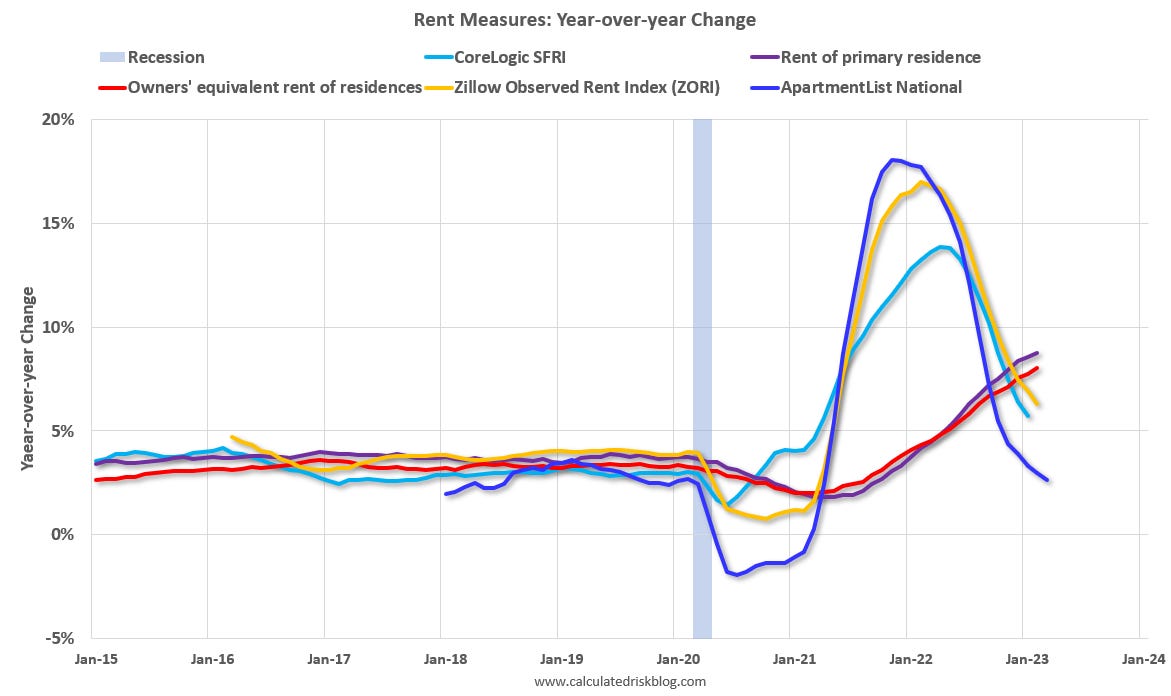
Here is a graph of the year-over-year (YoY) change for these measures since January 2015. Most of these measures are through April 2023, except CoreLogic is through May and Apartment List is through May 2023.
Note that new lease measures (Zillow, Apartment List) dipped early in the pandemic, whereas the BLS measures were steady. Then new leases took off, and the BLS measures have followed.
The CoreLogic measure is up 4.3% YoY in March, down from 5.0% in February, and down from a peak of 13.9% in April 2022.
The Zillow measure is up 5.3% YoY in April, down from 6.0% YoY in March, and down from a peak of 16.9% YoY in February 2022.
The ApartmentList measure is up 0.9% YoY as of May, down from 1.8% in April, and down from a peak of 18.3% YoY November 2021.
Both the Zillow measure (a repeat rent index), and ApartmentList are showing a slowdown in rental increases in rents. From Zillow:
“ZORI is a repeat-rent index that is weighted to the rental housing stock to ensure representativeness across the entire market, not just those homes currently listed for-rent.”
And from ApartmentList:
At Apartment List, we estimate the median contract rent across new leases signed in a given market and month. To capture how rents change in a market over time, we estimate the expected price change that a rental unit should experience if it were to be leased today.
Both of these measures reflect new leases, whereas most rental units don’t turnover every year (as captured by the BLS measures). The sharp increase in new lease rates in 2021 and early 2022 is spilling over into the consumer price index now.
The Rent of primary residence was up 8.8% YoY in May unchanged from up 8.8% YoY in April. The Owners’ Equivalent Rent (OER) was up 8.1% YoY in April up from 8.0% YoY in March. The YoY change in OER has probably close to a peak but will stay elevated for some time even though asking rent growth has slowed sharply.
Conclusion
My suspicion is year-over-year rent increases will slow further over the coming months with slow household formation, and as more supply comes on the market. Although asking rents increased in May according to ApartmentList, “rent growth is flattening out at a time of year when it’s normally picking up steam”. Since rents increased sharply last year in June and July, asking rents could be down YoY in the June or July ApartmentList reports.
My view is it is likely that we will see a year-over-year decline in asking rents sometime in the next couple of months.