CALCULATED RISK
By Bill McBride
In Part 1: Current State of the Housing Market; Overview for mid-April I reviewed home inventory and sales, and mortgage delinquencies.
House Prices
Reported YoY house price growth is still positive, but the Case-Shiller National Index slowed to 2.0% YoY in February.
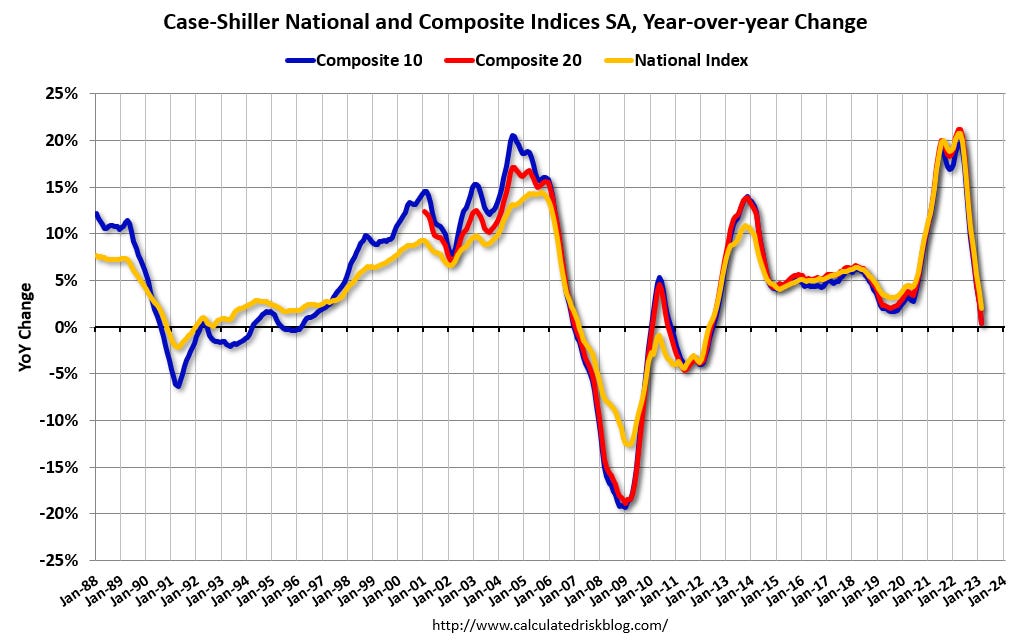
The MoM increase in the seasonally adjusted Case-Shiller National Index was at 0.16%. This increase followed seven consecutive MoM decreases.

Other measures of house prices indicated year-over-year slowing or further declines in March. The NAR reported median prices were down 0.9% YoY in March. Black Knight reported prices were up 1.0% YoY in March, and Freddie Mac reported house prices were up 1.0% YoY in March. Here is a comparison of year-over-year change in the FMHPI, median house prices from the NAR, and the Case-Shiller National index.
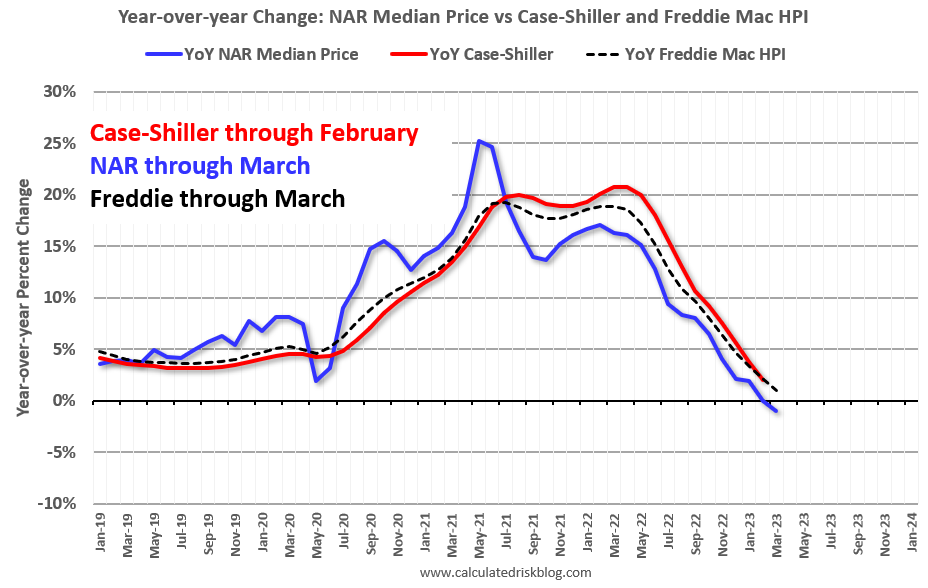
The FMHPI and the NAR median prices appear to be leading indicators for Case-Shiller. The median price was down YoY in March, and based on the recent trend, the FMHPI will be negative year-over-year in April or May – and Case-Shiller will follow within a few months.
In real terms, the Case-Shiller National index is down 4.6% from the peak, seasonally adjusted. Historically it takes a number of years for real prices to return to the previous peak, see House Prices: 7 Years in Purgatory.
30-Year Mortgage Rates Have Bounced between 6% and 7%
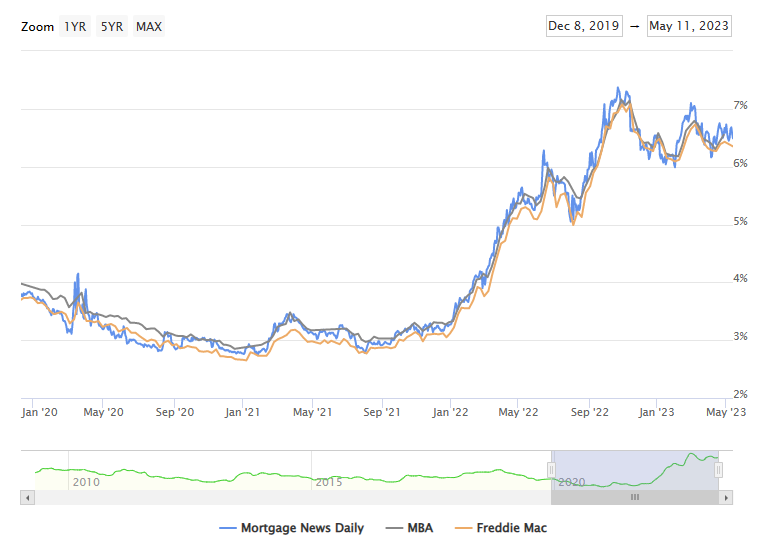
The following graph from MortgageNewsDaily.com shows mortgage rates since January 1, 2020. 30-year mortgage rates were at 6.49% on May 11th, up from 6.0% in early February, and down from the recent high of over 7% in early March – and still up sharply year-over-year.
A year ago, the payment on a $500,000 house, with a 20% down payment and 5.41% 30-year mortgage rates, would be around $2,249 for principal and interest. The monthly payment for the same house, with house prices up 2% YoY and mortgage rates at 6.49%, would be $2,576 – an increase of 15%.
But if we compare to two years ago, there is huge difference in monthly payments. In May 2021, the payment on a $500,000 house, with a 20% down payment and 3.09% 30-year mortgage rates, would be around $1,706 for principal and interest. The monthly payment for the same house, with house prices up 22.5% over two years and mortgage rates at 6.49%, would be $3,095 – an increase of 81%.
This increase in mortgage rates is probably the key reason new listings have declined sharply year-over-year – especially since a large number of homeowners refinanced at lower rates in 2020, 2021 and early 2022.
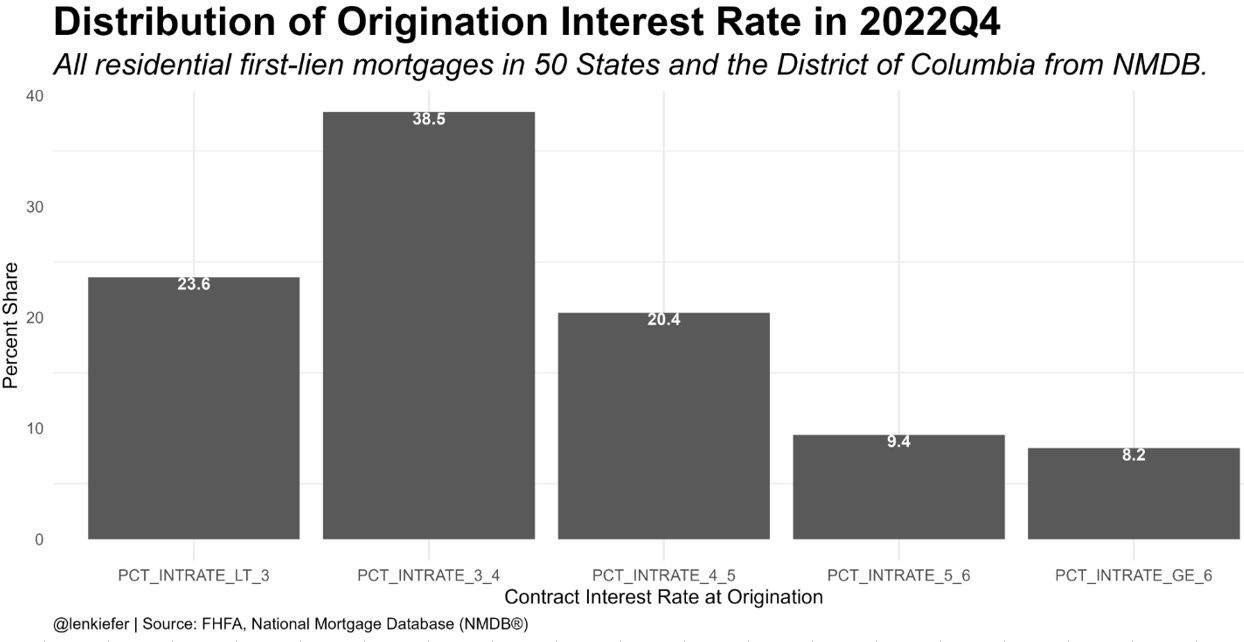
Economist Len Kiefer recently pointed out that “having nearly 2 out of 3 mortgages with a rate of 4% or less and market rates over 6% isn’t going to help with the inventory situation”. Here is a graph from Kiefer of the distribution of mortgage interest rates. This doesn’t include homeowners without a mortgage.
This shows that 62.1% of mortgages are under 4%, and 82.5% are under 5%. If these homeowners move, their monthly payments will increase substantially.
Here is a graph courtesy of market strategist Michael Antonelli, based on data from Black Knight. Michael circled the under 2.5% categories (over 2 million mortgages), but most of the existing mortgage are below 4%, and over 80% are under 5%.
This is very different from the housing bust, when many homeowners were forced to sell as their teaser rates expired and they could not afford the fully amortized mortgage payment. The current situation is similar to the 1980 period, when rates also increased quickly.
Year-over-year Rent Growth Continues to Decelerate
Tracking rents is important for understanding the dynamics of the housing market. For example, the sharp increase in rents helped me deduce that there was a surge in household formation in 2021 (See from September 2021: Household Formation Drives Housing Demand). This has been confirmed (mostly due to work-from-home), and also led to the supposition that household formation would slow sharply now (mostly confirmed) and that asking rents might decrease in 2023 on a year-over-year basis.
Here is a graph of the year-over-year (YoY) change for several rent measures since January 2015. Most of these measures are through March 2023, except CoreLogic is through February and Apartment List is through April 2023.
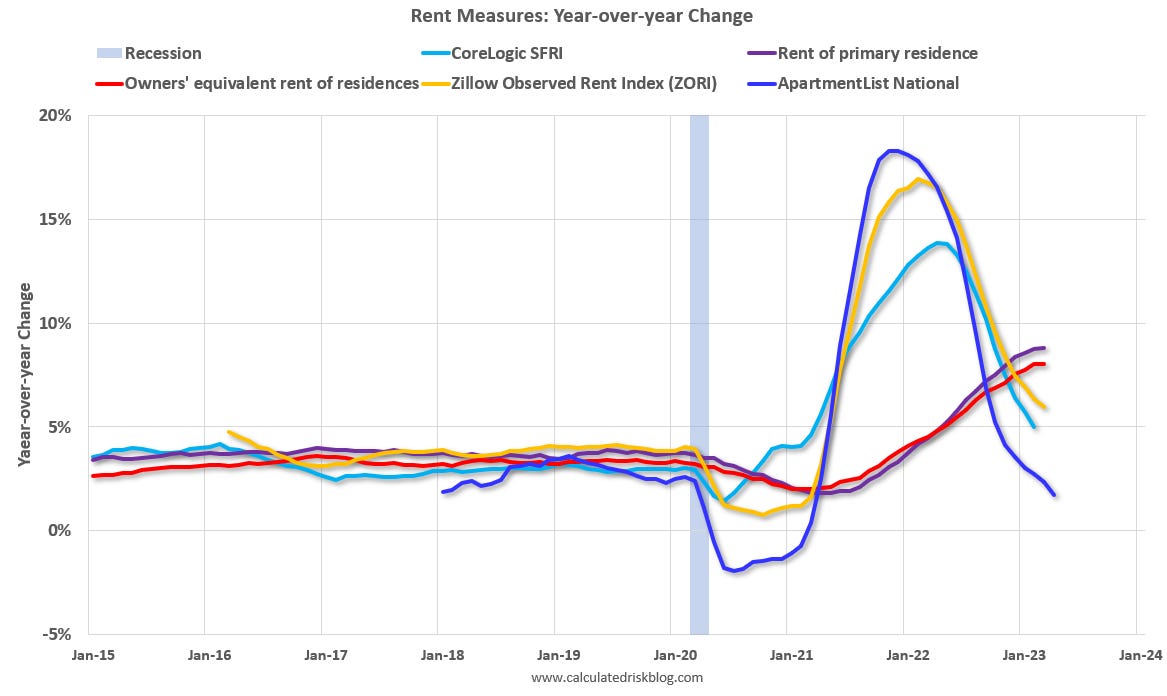
Asking rents are slowing down, and new supply is coming in on the market, and this suggests we might see asking rents down year-over-year soon. This is important for housing and also for monetary policy.
Conclusions
We have seen a significant year-over-year decline in new and existing home sales, although it is likely that activity has bottomed (but not prices).
House prices are under pressure due to higher mortgage rates, but prices are being supported by low levels of inventory. See: House Price Battle Royale: Low Inventory vs Affordability
Existing home sales will likely be down more year-over-year NSA in April compared to March, although there was one less selling day in April this year. Housing starts will probably show further declines – especially multi-family – and still a large number of housing units under construction.