CALCULATEDRISK
By Bill McBride
FHFA’s National Mortgage Database Q1 2023
Here is some data from the recently released FHFA’s National Mortgage Database showing the distribution of interest rates on closed-end, fixed-rate 1-4 family mortgages outstanding at the end of each quarter since Q1 2013 through Q1 2023.

This shows the surge in the percent of loans under 3%, and also under 4%, starting in early 2020 as mortgage rates declined sharply during the pandemic. Currently 23.3% of loans are under 3%, 61.3% are under 4%, and 81.2% are under 5%.
The percent of outstanding loans under 4% peaked in Q1 2022 at 65.3%, and the percent under 5% peaked at 85.6%.
This is very different from the housing bust, when many homeowners were forced to sell as their teaser rates expired and they could not afford the fully amortized mortgage payment. The current situation is similar to the 1980 period, when rates also increased quickly.
All of these low interest rate mortgages is the key reason new listings have fallen sharply (see Part I).
The second graph shows the average mortgage interest rate from 2013 through Q1 2023. Blue is the weighted average based on the value at origination, and red is the weighted average based on the Unpaid Principal Balance (UPB) as of the end of each quarter.

House Prices
Reported YoY house price growth turned negative in April, with the Case-Shiller National Index down 0.2%.
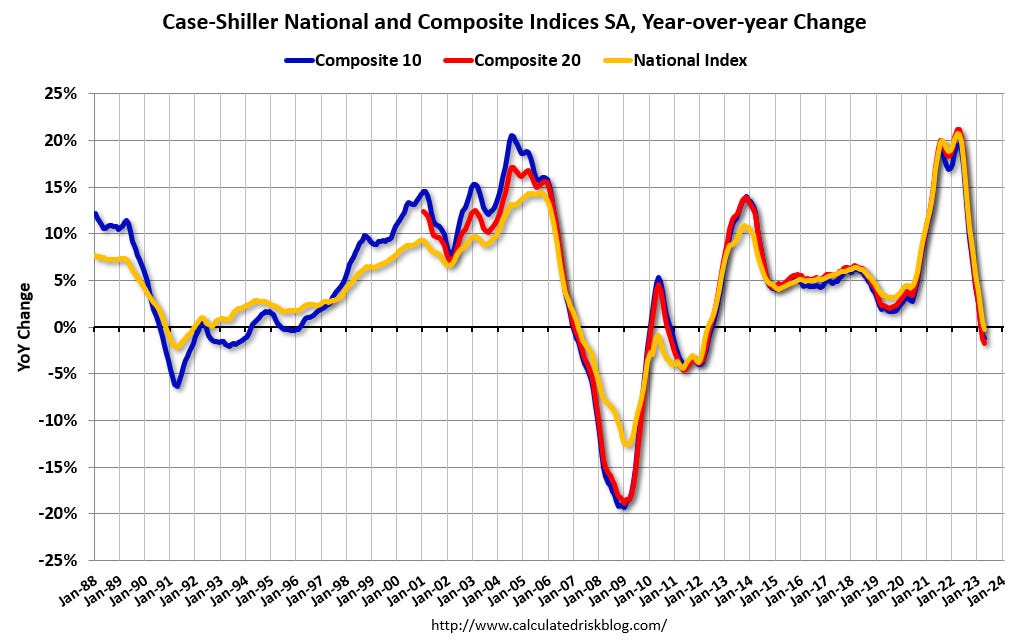
The MoM increase in the seasonally adjusted Case-Shiller National Index was at 0.53%. This was the third consecutive MoM increase following seven straight MoM decreases.

Most measures of house prices have shown an increase in prices over the last several months, and a key question is if prices will soften again later this year.
Other measures of house prices indicated year-over-year slowing or further declines in May. The NAR reported median prices were down 3.1% YoY in May. Black Knight reported prices were up 0.1% YoY in May, and Freddie Mac reported house prices were up 0.4% YoY in May. Here is a comparison of year-over-year change in the FMHPI, median house prices from the NAR, and the Case-Shiller National index.

The FMHPI and the NAR median prices appear to be leading indicators for Case-Shiller. Based on recent monthly data, and the FMHPI, it seems likely the YoY change in the Case-Shiller index will turn positive this summer.
In real terms, the Case-Shiller National index is down 3.8% from the peak, seasonally adjusted. Historically it takes a number of years for real prices to return to the previous peak, see House Prices: 7 Years in Purgatory.
30-Year Mortgage Rates Have Mostly Bounced between 6% and 7%
The following graph from MortgageNewsDaily.com shows mortgage rates since January 1, 2020. 30-year mortgage rates were at 6.96% on July 12th, near the recent highs, and up year-over-year. Just over a year ago, mortgage rates moved above 6% for the first time since 2008.

A year ago, the payment on a $500,000 house, with a 20% down payment and 5.71% 30-year mortgage rates, would be around $2,324 for principal and interest. The monthly payment for the same house, with house prices down 0.2% YoY and mortgage rates at 6.96%, would be $2,645 – an increase of 14%.
However, if we compare to two years ago, there is huge difference in monthly payments. In July 2021, the payment on a $500,000 house, with a 20% down payment and 3.09% 30-year mortgage rates, would be around $1,706 for principal and interest. The monthly payment for the same house, with house prices up 20.3% over two years and mortgage rates at 6.98%, would be $3,195 – an increase of 87%!
This increase in mortgage rates is probably the key reason new listings have declined sharply year-over-year – especially since a large number of homeowners refinanced at lower rates in 2020, 2021 and early 2022.
See: Could 6% to 7% 30-Year Mortgage Rates be the “New Normal”?
Year-over-year Rent Growth Continues to Decelerate
Tracking rents is important for understanding the dynamics of the housing market. For example, the sharp increase in rents helped me deduce that there was a surge in household formation in 2021 (See from September 2021: Household Formation Drives Housing Demand). This has been confirmed (mostly due to work-from-home), and also led to the supposition that household formation would slow sharply now (mostly confirmed) and that asking rents might decrease in 2023 on a year-over-year basis.
Here is a graph of the year-over-year (YoY) change for several rent measures since January 2015. Most of these measures are through May 2023, except CoreLogic is through April and Apartment List is through June 2023.

Asking rents are slowing down, and new supply is coming in on the market, and this suggests we might see asking rents down year-over-year soon.
Yesterday, the BLS noted in the CPI report: “The index for shelter was the largest contributor to the monthly all items increase, accounting for over 70 percent of the increase”.
This is important for housing and also for monetary policy. Fed Chair Powell mentioned he was watching services less rent of shelter earlier this year when this measure was up 7.6% year-over-year. This has fallen sharply and is now up 3.2% YoY.

Conclusions
We have seen a significant year-over-year decline in new and existing home sales, although it is likely that activity has bottomed. I’ll have more on the outlook for prices soon.
House prices are under pressure due to higher mortgage rates, but prices are being supported by low levels of inventory. See: House Price Battle Royale: Low Inventory vs Affordability.
Existing home sales will likely be down less year-over-year NSA in June compared to May.
Multi-family housing starts will probably show fairly significant declines soon, since lending has tightened, and the Architectural Billings Index is indicating a slowdown in multi-family design.