CALCULATEDRISK
By Bill McBride
In Part 1: Current State of the Housing Market; Overview for mid-June 2024 I reviewed home inventory, housing starts and sales.
In Part 2, I will look at house prices, mortgage rates, rents and more.
House Prices
The Case-Shiller National Index increased 6.5% year-over-year in March and will likely be about the same YoY in April (based on other data).
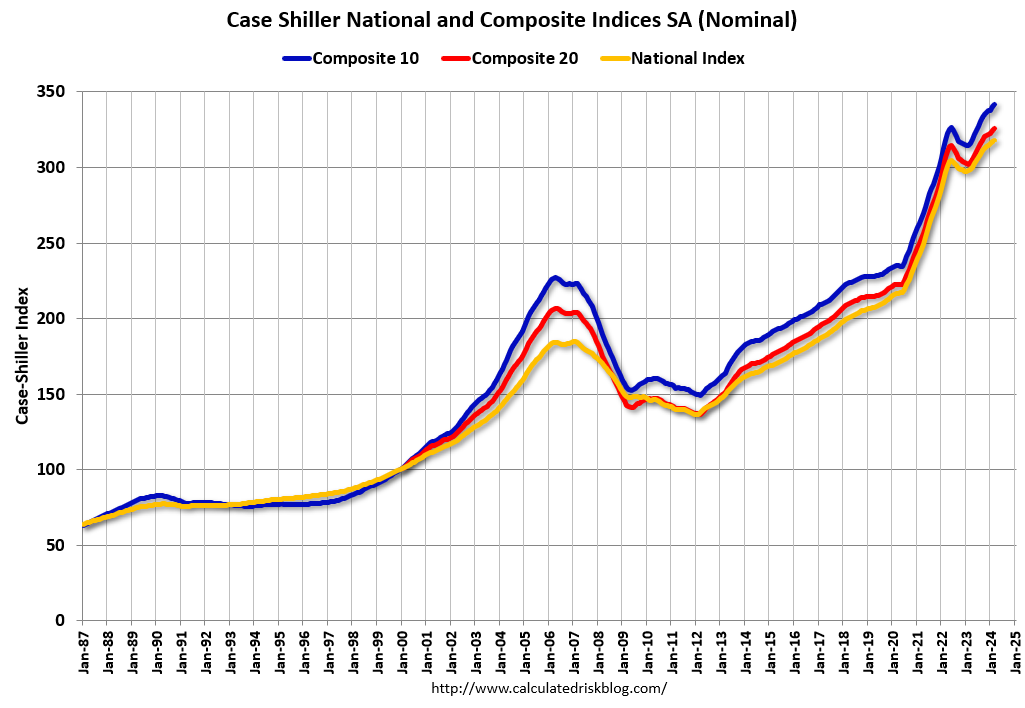
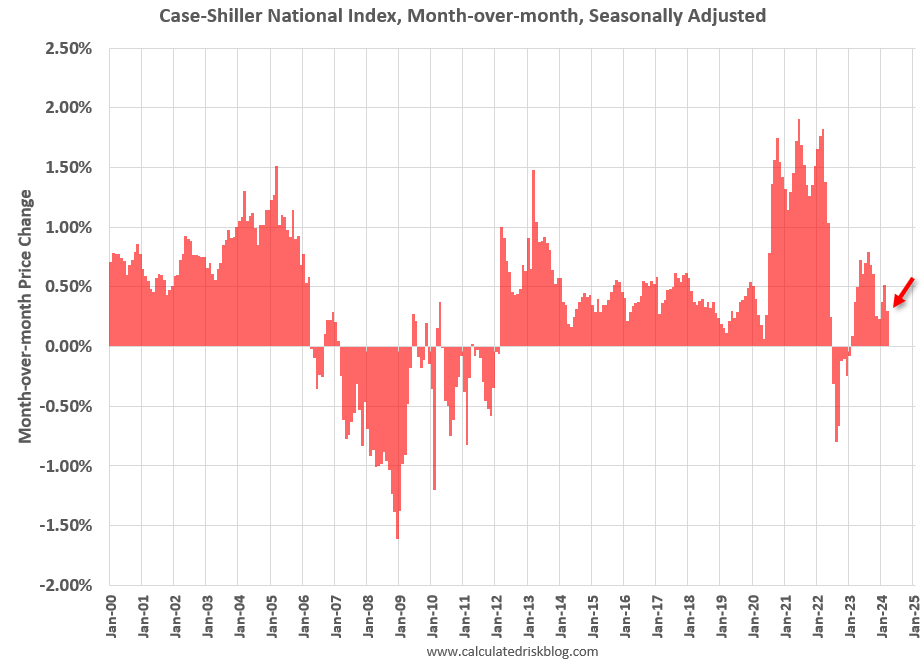
The MoM increase in the seasonally adjusted (SA) Case-Shiller National Index was at 0.30%. This was the fourteenth consecutive MoM increase, but a smaller MoM increase than the previous two months.
In Question #9 for 2024: What will happen with house prices in 2024? I discussed my outlook for house prices in 2024. A review …
In question #9 I wrote:
“I don’t expect inventory to reach 2019 levels but based on the recent increase in inventory maybe more than half the gap between 2019 and 2023 levels will close in 2024. If existing home sales remain sluggish, we could see months-of-supply back to 2017 – 2019 levels.
That would likely put price increases in the 3% to 4% range in 2024. I don’t expect either a crash in prices or a surge in prices. And as usual, we will have to watch inventory and adjust the outlook.”
As I noted in Part 1, inventory is increasing year-over-year, but is still well below 2019 levels. This outlook for prices still seems reasonable – I expect the YoY increase to slow later this year – and depends on changes in inventory. I don’t expect either a crash in prices or a surge in prices.
Other measures of house prices suggest prices will be up about the same YoY in the April Case-Shiller index. The NAR reported median prices were up 5.7% YoY in April, up from 4.7% YoY in March. ICE reported prices were “cooling”, but still up 5.1% YoY in April, down from 5.7% YoY in March, and Freddie Mac reported house prices were up 6.5% YoY in April, down from 6.6% YoY in March.
Here is a comparison of year-over-year change in the FMHPI, median house prices from the NAR, and the Case-Shiller National index.
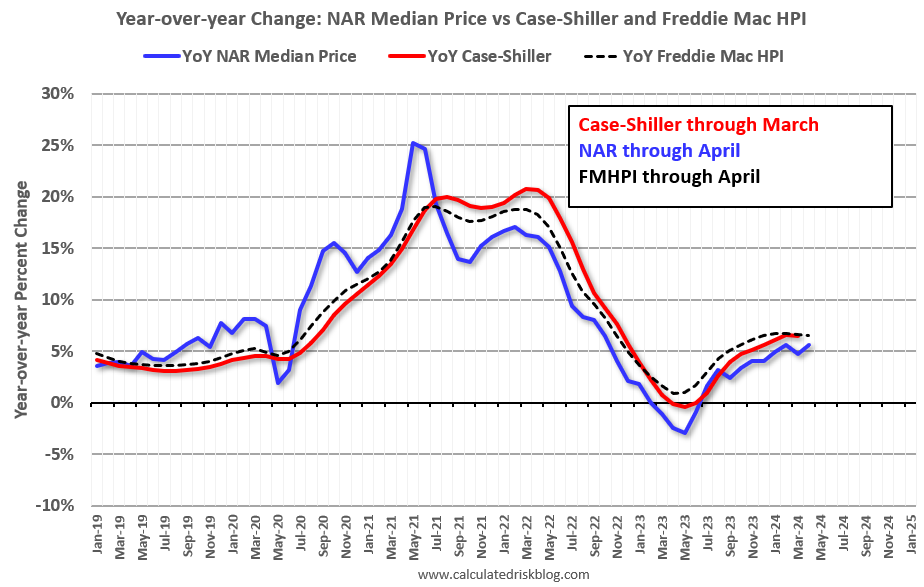
The FMHPI and the NAR median prices appear to be leading indicators for Case-Shiller. Based on recent monthly data, and the FMHPI, the YoY change in the Case-Shiller index will likely be about the same YoY in April as in March.
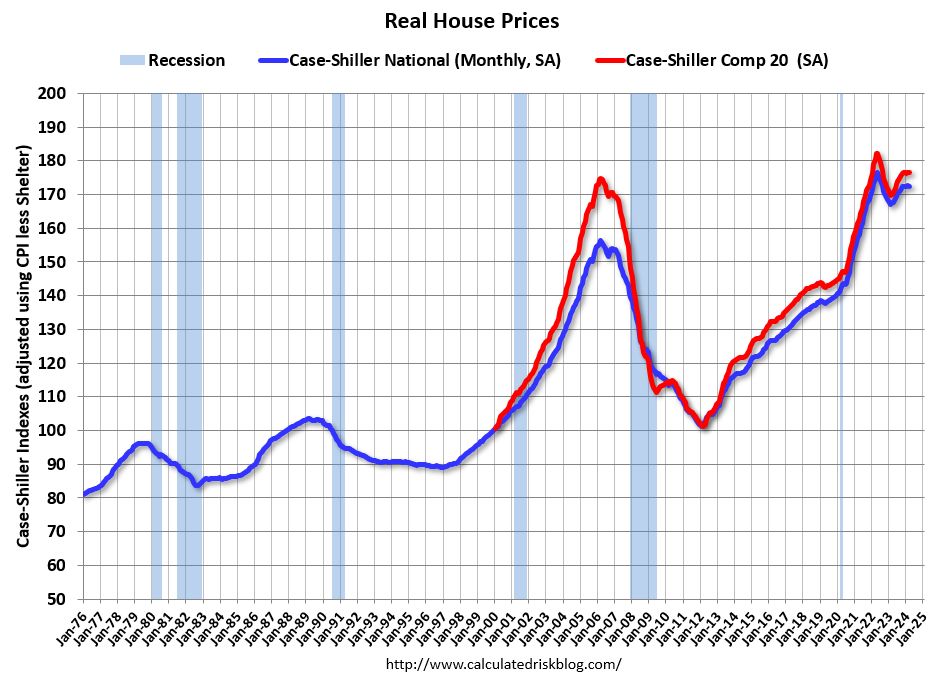
In real terms, the Case-Shiller National index is down 2.2% from the peak, seasonally adjusted. Historically it takes a number of years for real prices to return to the previous peak.
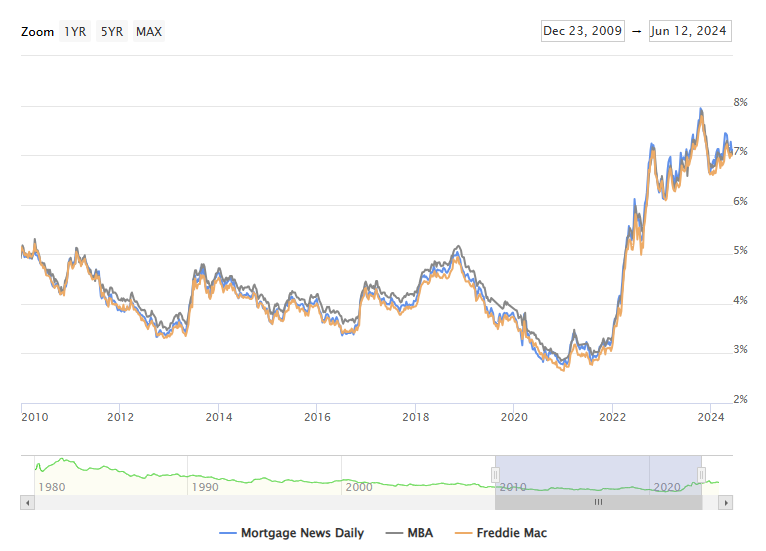
30-Year Mortgage Rates are Close to 7%
The following graph from MortgageNewsDaily.com shows mortgage rates since January 1, 2010. 30-year mortgage rates were at 6.98% on June 12th, down due to the better-than-expected inflation reports (CPI was soft yesterday, and PPI was soft today, so we will likely see a further decline in mortgage rates).
A year ago, 30-year mortgage rates were also at 6.98%, two years ago rates were at 6.18%, and three years ago rates were at 3.05%.
A year ago, the payment on a $500,000 house, with a 20% down payment and 6.98% 30-year mortgage rates, would be around $2,656 for principal and interest. The monthly payment for the same house, with house prices up 6.5% YoY and mortgage rates at 6.98%, would be $2,828 – an increase of 6.5%.
However, if we compare to three years ago, there is huge difference in monthly payments. In 2021, the payment on a $500,000 house, with a 20% down payment and 3.05% 30-year mortgage rates, would be around $1,697 for principal and interest. The monthly payment for the same house, with house prices up 30% over three years and mortgage rates at 6.98%, would be $3,441 – an increase of 103%! Monthly payments more than doubled!
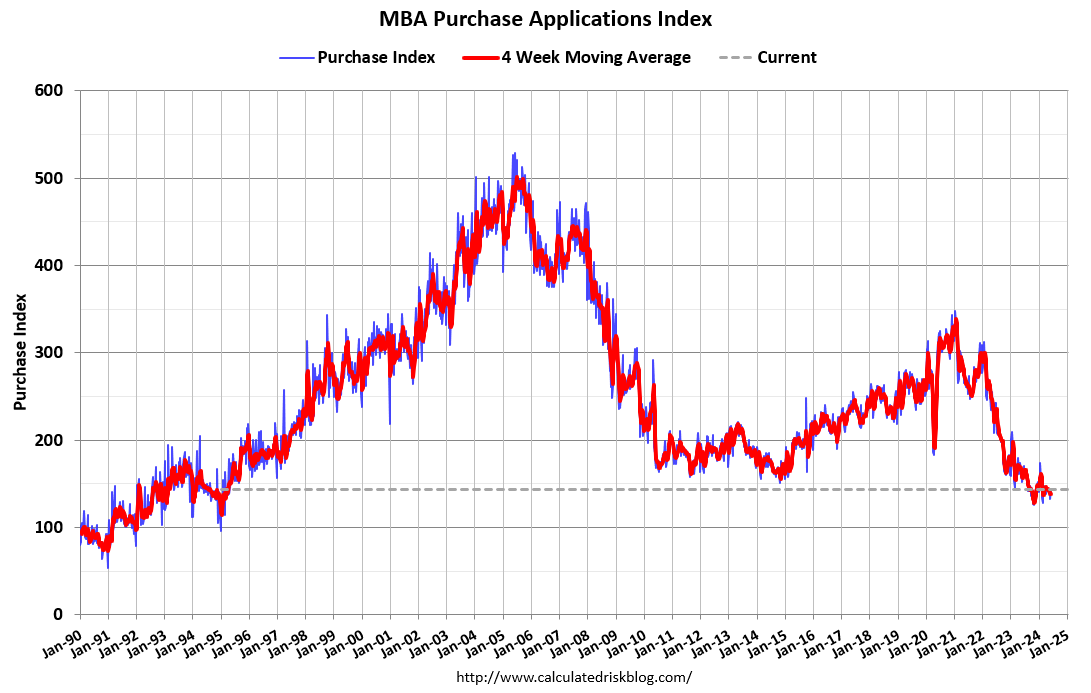
Mortgage Applications Remain Low
Here is a graph showing the MBA mortgage purchase index released this week. Purchase application activity is up from the lows in late October and early November, and still below the lowest levels during the housing bust.
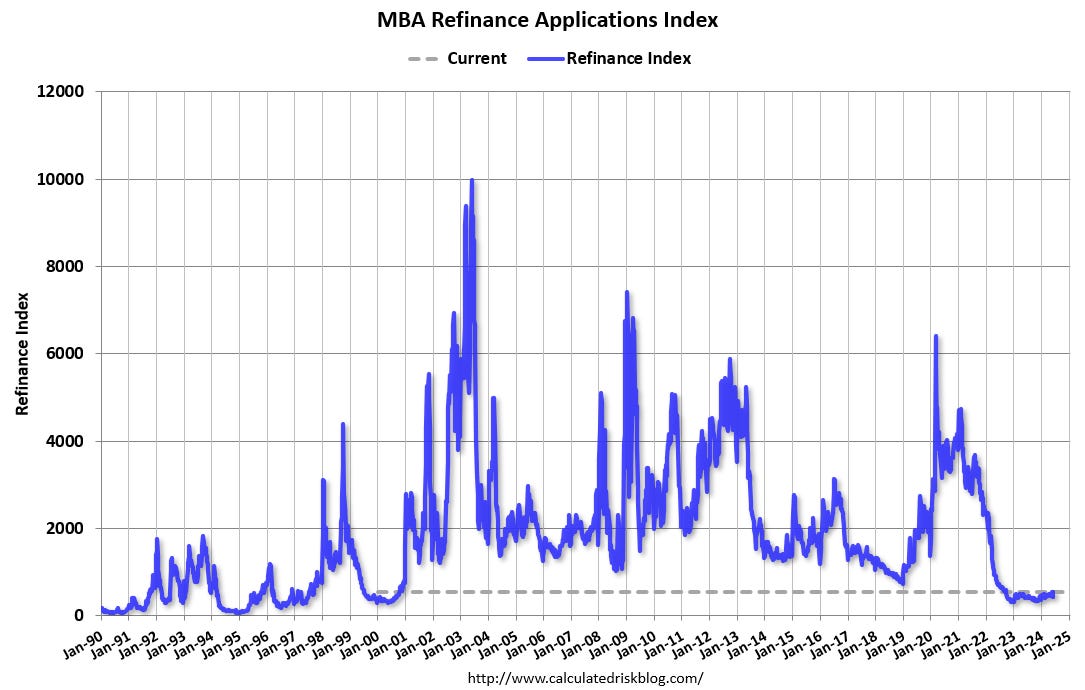
And the next graph shows the refinance index since 1990. Refinance activity has increased recently, but you have to squint to see the increase!
Asking Rents Mostly Unchanged Year-over-year
Here is a graph of the year-over-year (YoY) change for these measures since January 2015. Most of these measures are through April 2024, except CoreLogic is through March and Apartment List is through May 2024.
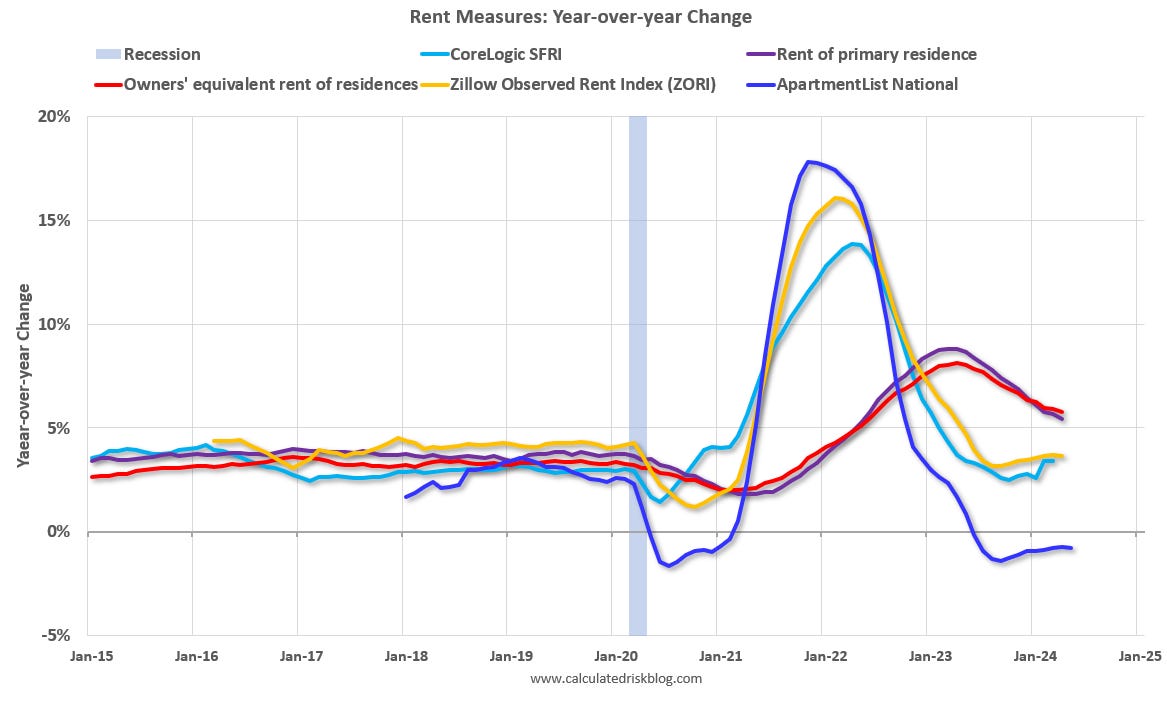
Asking rents are mostly unchanged YoY for multi-family (single family rents are up), and with new supply coming on the market, we will likely see further softness in asking rents.
However, the official measures are still catching up to the private data.
Low Levels of Real Estate Owned
Earlier this week, I noted that with substantial equity, and low mortgage rates (mostly at a fixed rates), few homeowners will have financial difficulties during this cycle. This is important for prices, since house prices tend to be sticky downwards in the absence of significant distressed sales.